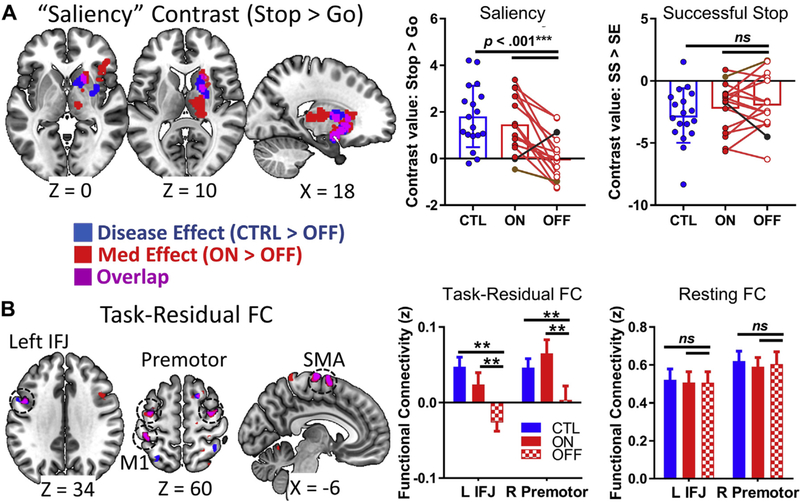
Fig. 3.

Functional magnetic resonance imaging results: Group differences for SST contrasts and functional connectivity (FC), showing disease effects (controls > PD “off”, shown in blue), medication effects (PD “on” > PD “off”, shown in red), and their overlap (shown in purple). (A) Left: Significant disease and medication effects are shown in the thalamus, striatum, and right insula/inferior frontal gyrus for the saliency contrast, including an overlapping region in the right striatum (purple). Right: Post hoc analysis showing that the PD group had lower right striatum saliency-related activations than when on levodopa or compared to controls; however, there were no consistent group differences in this region between successful versus failed stopping. The individual with self-reported depression (brown dot) and the individual with low go accuracy (black dot) are indicated. (B) Left: In exploratory task-residual functional connectivity analysis using the right striatum region from part (A) as a seed region, there were overlapping disease and medication effects in L IFJ, M1, SMA, and bilateral premotor cortices. Right: Post hoc analysis for 2 example regions (L IFJ and R premotor) showing group differences in task-residual functional connectivity, but not resting-state functional connectivity. Task contrast results have a cluster-forming threshold of p < 0.005, with a nonparametric p < 0.05 FWE cluster correction, using SnPM13. Functional connectivity results were not significant at this nonparametric cluster-level threshold, and so only the conjunction is analyzed at an exploratory threshold of p < 0.0025 uncorrected, with a minimum cluster size k > 20. **p < 0.01; ***p < 0.001. Abbreviations: CTL, control; FWE, family-wise error; IFG, inferior frontal junction; L, left; M1, primary motor cortex; PD, Parkinson’s disease; R, right; SMA, supplementary motor area. (For interpretation of the references to color in this figure legend, the reader is referred to the Web version of this article.)
