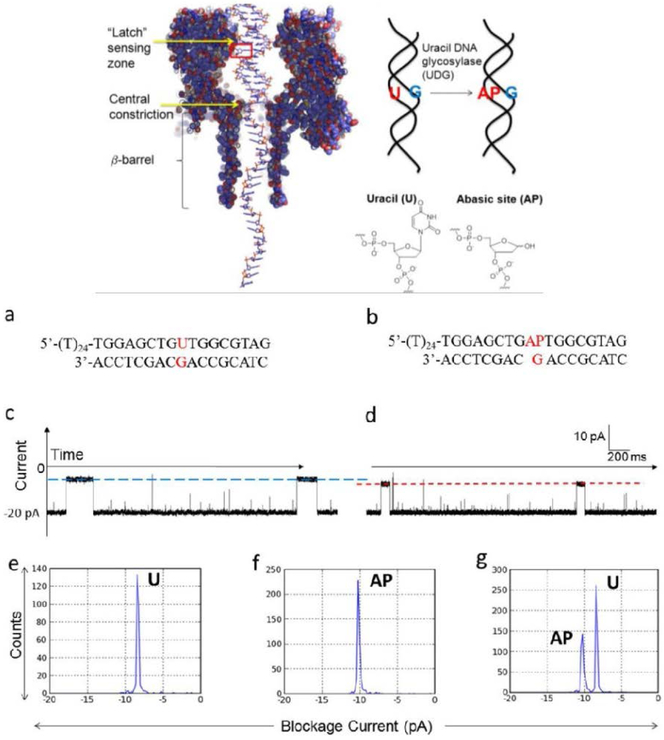
Figure 8. Abasic site detection in the latch zone of the nanopore by monitoring the UDG enzyme activity for dsDNA in the nanopore.
Top scheme: Left: The structure of dsDNA with a 5’- poly(T)24 tail within WT α-HL. The box indicates the location of the uracil (U) base or the abasic site (AP). Right: Scheme of the UDG hydrolysis reaction. The α-HL structure was taken from pdb 7AHL. DNA structure is shown on a 1:1 scale with α-HL. a, Sequence of the starting material formed by a 41-mer U-containing strand hybridized to a 17-mer strand. b, Sequence of the product containing AP. c, d, Sample current-time (i-t) traces for blockages generated by the U duplex (c) or the AP duplex (d) in individual experiments. The blue and red lines indicate the current blockage levels used to determine the duplex identity. e, f, g, Histograms of current blockage levels for the U duplex (e), AP duplex (f) and for a mixture of U and AP duplexes (g, mole ratio ~2:1). Single-nucleotide recognition was achieved between the U-containing duplex (a, c, and e) and the AP-containing duplex (b, d, and f) based on a ~2 pA difference in blockage current levels of the unzipping events in a 14 μM DNA, 150 mM buffered KCl solution at −120 mV. Reprinted with permission from reference [99].

