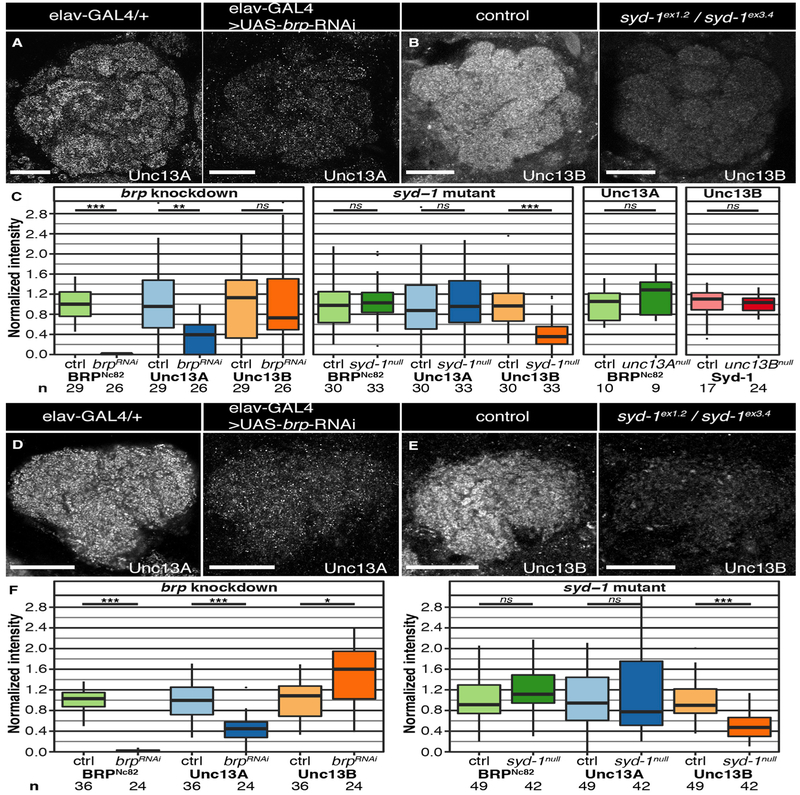
Figure 3. Reduction of Scaffold Proteins BRP and Syd-1 Results in Isoform-Specific Downregulation of Unc13s in the Adult Drosophila Brain.
(A and B) Confocal images of ALs stained against BRPNc82, Unc13A, and Unc13B. All scale bars, 20 μm. Flies with a pan-neuronal brp knockdown (KD; elav-GAL4 > UAS-brp-RNAi) in comparison to a control group (elav-GAL4/+); staining against Unc13A (A). syd-1null mutant flies (sydex1.2/sydex3.4) in comparison to w1118 controls; staining against Unc13B (B).
(C) Average staining intensities of BRP, Unc13A, and Unc13B in the KD or deletion situation normalized to controls show a significant downregulation of average intensity levels of Unc13A (p = 0.0016 for the brp KD). Syd-1 deletion results in downregulation of Unc13B (p = 0.000008). Average intensities of BRP and Syd-1 in unc13A and unc13B deletion mutants, respectively, normalized to controls (unc13B deletion: pacdel100B; unc13P84200; unc13A deletion: ems7.5/unc13P84200). The intensity levels of scaffold proteins were not altered in the mutants.
(D and E) Confocal images of calyces stained against BRPNc82, Unc13A, and Unc13B. All scale bars, 20 μm. Flies with a pan-neuronal brp KD in comparison to controls; staining against Unc13A (D). Syd-1null mutants in comparison to controls; staining against Unc13B (E).
(F) Average staining intensities of BRP, Unc13A, and Unc13B in the KD or deletion situation normalized to controls show a significant downregulation of average intensity levels of Unc13A (p = 0.000018) and a significant upregulation of Unc13B (p = 0.0049) in the brp KD animals. Deletion of syd-1 results in downregulation of Unc13B (p = 0.000002). Association tests were conducted using linear mixed models with imaging batch and animal as nested random effects. Bonferroni-corrected significance thresholds α = 0.0167 for the brp KD and the syd-1 deletion and α = 0.025 for the unc13A/B deletions. Graphs as explained for Figure 1.
See also Figure S3.

