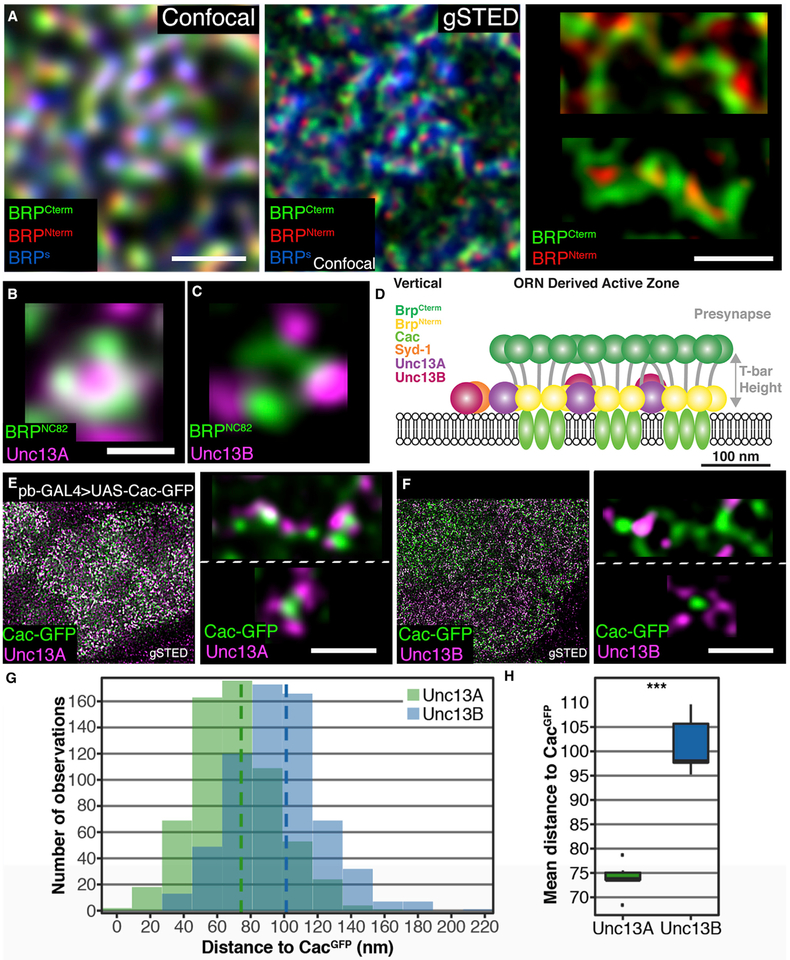
Figure 4. Nanoscopic Organization of AZs at ORN-to-PN Synapses.
(A) Sections of adult ALs at confocal and STED resolution. All scale bars, 500 nm. ORCO-GAL4 > UAS-brp-short-GFP brains with staining against GFP (confocal resolution), BRPC-Term (BRPNc82), and BRPN-Term.
(B and C) Magnified planar AZs. Scale bars, 200 nm. Staining against BRPNc82 and Unc13A (B). Staining against BRPNc82 and Unc13B (C).
(D) Cartoon depicting the assumed AZ composition in a side view.
(E) VA2 glomeruli in pb-GAL4 > UAS-Cac-GFP flies showing GFP with an Unc13A staining. Blow-up top: magnified elongated multimeric AZ, Cac-GFP, and Unc13A. Bottom: magnified planar AZ, Cac-GFP, and Unc13A.</p/>(F) VA2 glomeruli in pb-GAL4 > UAS-Cac-GFP flies showing GFP with an Unc13B staining. Blow-up top: magnified elongated multimeric AZ, Cac-GFP, and Unc13B. Bottom: magnified planar AZ, Cac-GFP, and Unc13B.
(G) Histogram of distance bins of either Unc13A to Cac-GFP (green) or Unc13B to Cac-GFP (blue).</p/>(H) Unc13B is further away from Cac-GFP than Unc13A is, p = 9.99 × 10⁻¹⁵, n = 619 measurements for Unc13A and n = 647 for Unc13B across six animals each. Association tests were conducted using linear mixed models with scan, hemisphere, and animal as nested random effects. Graphs as explained for Figure 1.

