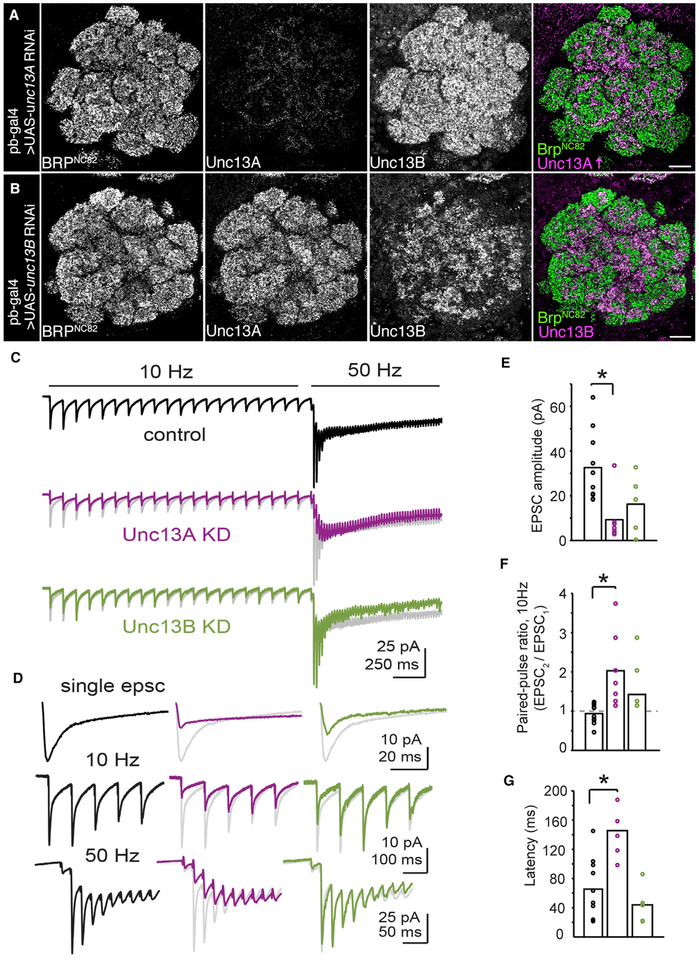
Figure 5. Unc13A and Unc13B Isoforms Play Distinct Roles in Synaptic Transmission at ORN-to-PN Synapses.
(A and B) Confocal sections of adult ALs. All scale bars, 10 mm. Staining against BRPNc82, Unc13A, and Unc13B in pb-GAL4 > UAS-unc13A RNAi flies. The Unc13A brightness was increased in the merged image for visibility (A). Anti-BRPNc82, Unc13A, and Unc13B staining in pb-GAL4 > UAS-unc13B RNAi flies (B).
(C) Group-averaged evoked synaptic currents in control (n = 10 cells), unc13A KD (n = 7 cells), and unc13B KD (n = 5 cells) flies during 10 Hz and 50 Hz stimulation of the antennal nerve. The average response from control recordings is shown in gray behind the average unc13A KD and unc13B KD traces for direct comparison.
(D) Group-averaged data from (C) showing the first EPSC (top), the onset of the 10 Hz response (middle), and the onset of 50 Hz response (bottom), reproduced on zoomed-in timescales. In (C) and (D), stimulus artifacts were minimized for clarity by linearly extrapolating between the pre- and post-stimulation artifact periods, typically 2–3 ms. At the transition from 10 Hz to 50 Hz stimulation, there is facilitation of the EPSC amplitude in control and unc13B KD experiments. This property is lost following unc13A KD and varies across cells.
(E) Quantification of the first EPSC amplitude across genotypes. EPSC amplitudes were significantly different between groups (F = 6.28; p < 0.01, one-way ANOVA with Tukey post hoc comparison). The first EPSC was significantly smaller in unc13A KD flies than in controls (p < 0.01, unpaired Student’s t test) and not significantly reduced after unc13B KD.
(F) Quantification of the paired-pulse ratio during 10 Hz stimulation across genotypes. The paired-pulse ratio varied between groups (F = 6.21; p < 0.01, one-way ANOVA with Tukey post hoc comparison). The paired-pulse ratio was significantly elevated in unc13A KD flies (p < 0.01, unpaired Student’s t test), but not in unc13B KD.
(G) The latency to peak evoked current from the onset of 50 Hz stimulation. The time to peak current was different between groups (F = 15.07; p < 0.001, one-way ANOVA with Tukey post hoc comparison), and was increased relative to controls in unc13A KD flies (p < 0.001). Bar charts represent mean values.
See also Figures S4 and S5.

