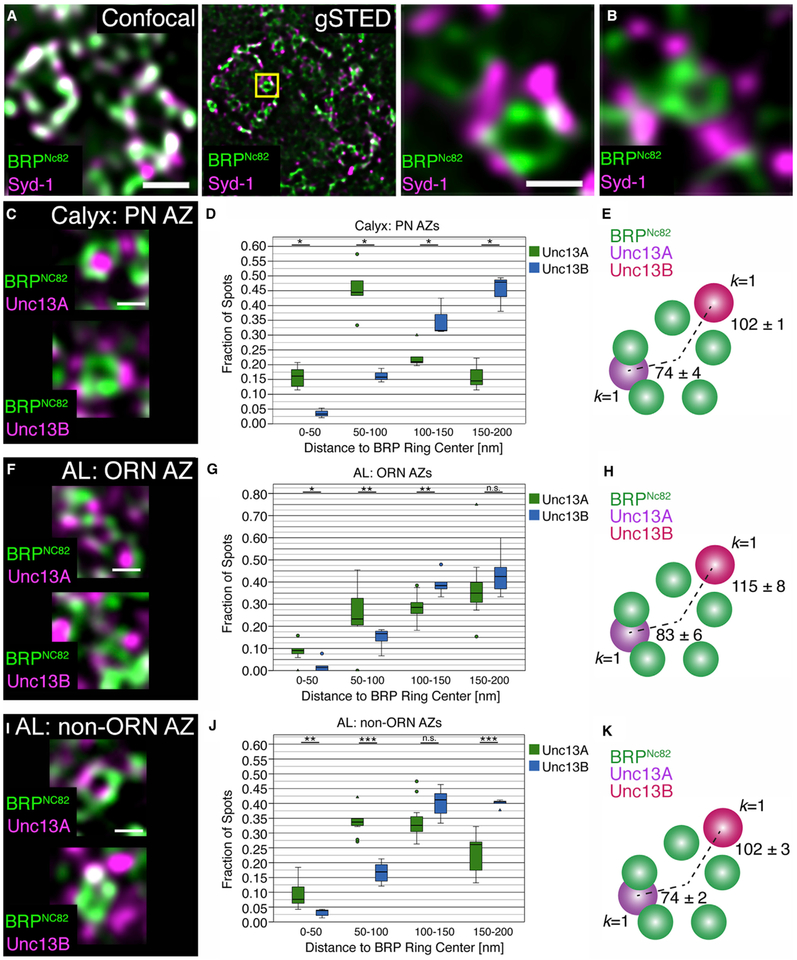
Figure 7. Comparative STED Analysis for ORN-, LN-, and PN-Derived AZs.
(A) Magnified section of an adult wild-type calyx imaged by conventional confocal (left) and time-gated STED (gSTED) microscopy. Scale bar, 500 nm.
(B) Staining against BRPNc82 and Syd-1. The magnified insets show a planar AZ within the calyx microglomeruli and in the AL. Scale bar, 200 nm.
(C) Planar view of BRPNc82 and Unc13A (above) or Unc13B (below) at a PN AZ in the calyx (gSTED). Scale bar, 200 nm.
(D and E) Cluster distance (D) and k nearest-neighbor analysis (E). Boxplot shows the number of Unc13A and Unc13B puncta at defined distances to the center of the BRP ring, normalized to the total number of puncta for each isoform up to 200 nm from the BRP ring center (D; Unc13A: n = 5 brains, 190 AZs; Unc13B: n = 3 brains, 150 AZs). (E) Scheme representing the k nearest-neighbor analysis (k = 1). At the PN AZs, the first Unc13A spot was found closer to the BRP ring center than any Unc13B spot (p < 0.05, Mann-Whitney U (MWU) test).
(F) Planar view of BRPNc82 and Unc13A (upper) or Unc13B (lower) at ORN-derived AZs (gSTED). Note the concatameric structure of the BRP rings. Scale bar, 200 nm.
(G) Cluster distance analysis at ORN AZs in the AL as in (D; Unc13A: n = 11 brains, 128 AZs; Unc13B: n = 5 brains, 97 AZs).
(H) Scheme representing the k nearest-neighbor analysis (k = 1). At the ORN AZs, the first Unc13A spot was found closer to the BRP ring center than any Unc13B spot (p < 0.01, MWU test).
(I) Example of gSTED images of BRPNc82 and Unc13A (upper) or Unc13B (lower) in planar view at non-ORN AZs in the AL. Scale bar, 200 nm.
(J) Cluster distance analysis at non ORN AZs in the AL as in (D; Unc13A: n = 11 brains, 446 AZs; Unc13B: n = 5 brains, 298 AZs).
(K) Scheme representing the k nearest-neighbor analysis (k = 1). At the non-ORN synapses in the AL, the first Unc13A spot was found closer to the BRP ring center than any Unc13B spot (p < 0.001, MWU test). *p < 0.05, **p < 0.01, ***p < 0.001, ns, not significant, Mann-Whitney U (MWU) tests. Values indicate mean ± SEM. Graphs as explained for Figure 1.

