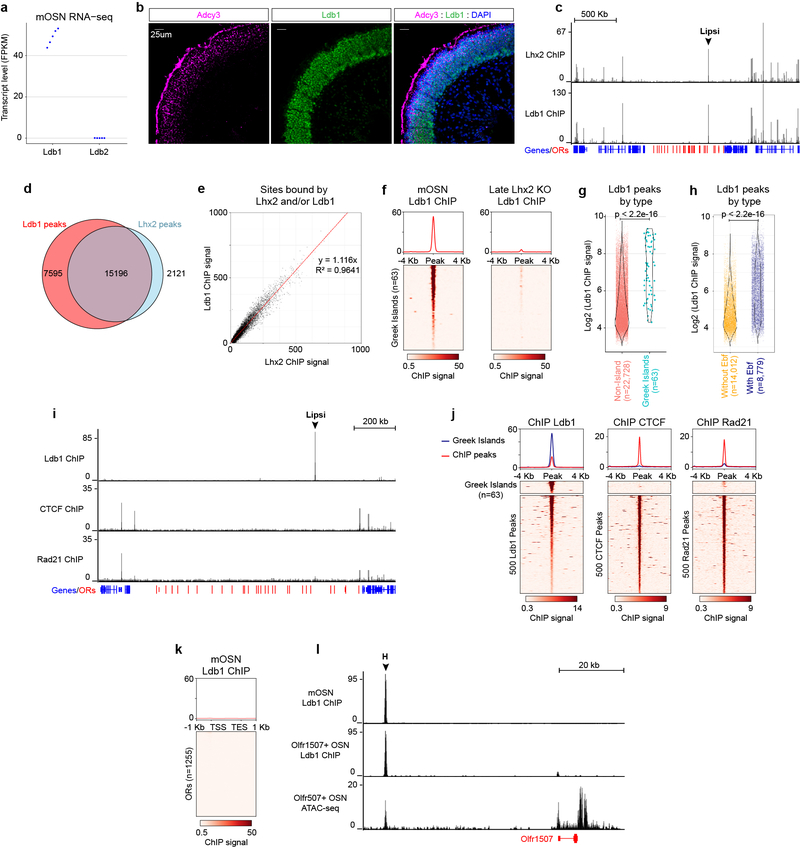
Extended Data Figure 6: Ldb1 expression and genomic distribution in mOSNs.
a, Transcript level, expressed as fragments per kilobase per million mapped reads (fpkm), of the two Ldb family members in mOSN RNA-seq data sets (n=5 biological replicates). b, Sections of olfactory epithelium stained for Ldb1 (green) and Adcy3 (magenta), a marker for mOSNs. Nuclei are labeled with DAPI (blue). Scale bar = 25um. Similar results were obtained from four independent experiments. c, Ldb1 and Lhx2 ChIP-seq signal in mOSNs across the OR gene cluster containing the Greek Island Lipsi. OR genes are red and all other genes are blue. Plot shows pooled data from 2 biological replicates for Lhx2 and 3 biological replicates for Ldb1, each of which yielded similar results when analyzed separately. Values are counts per 10 million reads. d, Extensive overlap between consensus Lhx2 and Ldb1 ChIP-seq peak sets. e, linear relationship between normalized Lhx2 ChIP signal and Ldb1 ChIP signal. Any peak observed in at least two of the 5 experiments (2 for Lhx2 and 3 for Ldb1) was included (n=26,667) and plotted together with a best fit line obtained by linear regression with y-intercept set to 0. f, Ldb1 ChIP signal over Greek Islands in mOSNs and Late Lhx2 KO mOSNs. Heatmap shows pooled data from 3 biological replicates for mOSNs and 2 biological replicates for Late Lhx2 KO cells, each of which yielded similar results when analyzed separately. Values are counts per 10 million reads. g, Normalized Ldb1 ChIP-seq signal is greater for Ldb1 peaks that overlap Greek Islands than for peaks that do not (p < 2.2e-16, two-sided Wilcoxon rank sum test, n=63 for Greek Islands, n=22,728 for non-Island peaks). Violin plots are scaled to the same area and show density for the full set of points over the full range. h, Normalized Ldb1 ChIP-seq signal is greater for Ldb1 peaks that overlap Ebf ChIP peaks than for peaks that do not (p < 2.2e-16, two-sided Wilcoxon rank sum test, n=8,779 for Ldb1 peaks that overlap Ebf peaks, n=14,012 for non-Ebf peaks). Violin plots are scaled to the same area and show density for the full set of points over the full range. i, mOSN ChIP-seq for Ldb1, CTCF, and the cohesin-subunit Rad21 across the OR gene cluster containing the Greek Island Lipsi. OR genes are red and all other genes are blue. Plot shows pooled data from 3 biological replicates for Ldb1 and 2 biological replicates CTCF and Rad21. Values are counts per 10 million reads. Analyzing each replicate separately yielded similar results. j, mOSN ChIP signal over Greek Islands and non-Geek Island ChIP-seq peaks. For ChIP-seq peaks, the heatmap shows 500 randomly selected peaks and the plot shows data from the full consensus set of peaks (n=22,791 for Ldb1, n=24,883 for CTCF, and n=9,882 for Rad21). Plots show pooled data, similar results were obtained with each replicate (n=3 for Ldb1 ChIP-seq and n=2 for CTCF and Rad21 ChIP-seq). Units are counts per 10 million reads. k, As in j, but showing Ldb1 ChIP signal over OR genes (n=1,255) in mOSNs. l, Ldb1 ChIP-seq from control mOSNs (top) and Olfr1507-expressing cells (middle). Strong signal is observed on the Greek Island, H, in both populations but only a very weak signal on the Olfr1507 promoter when it is transcriptionally engaged. Pooled data from 3 biological replicates is shown for the mOSNs. One of two biological replicates is shown for Olfr1507+ OSNs; the other replicate yielded similar results but with lower enrichment in peaks. ATAC-seq from the Olfr1507-expressing cells (bottom) shows that the promoter of Olfr1507 has similar accessibility to the H element. ATAC-seq plot shows pooled data from two biological replicates that yielded similar results.

