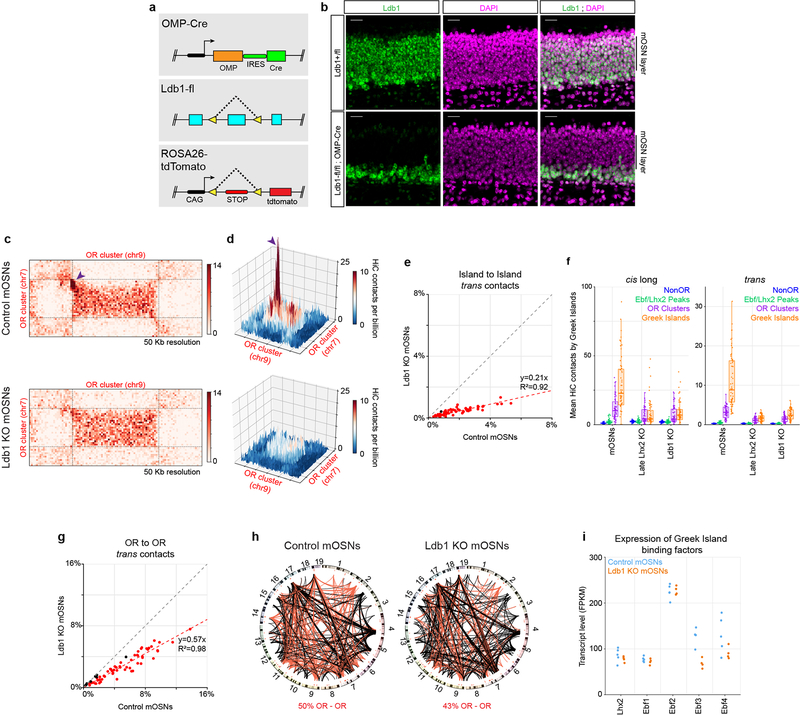
Extended Data Figure 7: Effects of conditional Ldb1 deletion in Greek Island interactions and OR expression.
a, Schematic of the genetic strategy used to generate Ldb1 KO mOSNs that are fluorescently labeled b, In Ldb1fl/fl;OMP-Cre mice, Ldb1 (green) is lost from mOSNs but retained in basal immature cells. Nuclei are stained with DAPI (magenta). Scale bar = 20um. Similar results were obtained from three independent experiments. c, HiC contacts between a pair of OR clusters located on different chromosomes in control (top), and Ldb1 KO (bottom) OSNs. A HiC hotspot between interacting Greek Islands in control mOSNs (arrowheads) is absent in Ldb1 KO OSNs d, 3D projection of the same OR cluster pair in control and Ldb1 KO OSNs. e, trans interactions of each Greek Island (n=59) with the other Greek Islands as fraction of the total HiC contacts in mOSNs versus Ldb1 KO cells. Greek Islands changed more than 2-fold are red. f, For each Greek Island, the mean number of cis long range (left) and trans (right) HiC contacts per billion made to every non-OR sequence (at 50 Kb resolution), intergenic Lhx2 & Ebf bound peak (outside of OR clusters), or Greek Island. Box indicates median, upper, and lower quartiles while whiskers indicate 1.5 * the interquartile range. g, same as e but for trans contacts between OR gene clusters (n=67). Clusters changed more than 1.5-fold are red. h, Circos plots depicting the strongest 1000 interchromosomal interactions genomewide at 1Mb resolution in control mOSNs (left), Ldb1 KO mOSNs (right). Red lines represent OR-OR contacts and black lines non-OR-non-OR contacts. Line thickness increases with contact frequency. Chromosome numbers depicted at the periphery of the circle. i, Transcript levels of Greek Island-binding factors in RNA-seq data from control mOSNs and Ldb1 KO mOSNs. Transcript levels of Ebf3 are reduced approximately 2-fold (p = 0.031 for greater than 1.5-fold change, DESeq2 normalized Wald test with n=5 for control mOSNs and n=4 Ldb1 KO). The expression of other factors is not significantly different between conditions.

