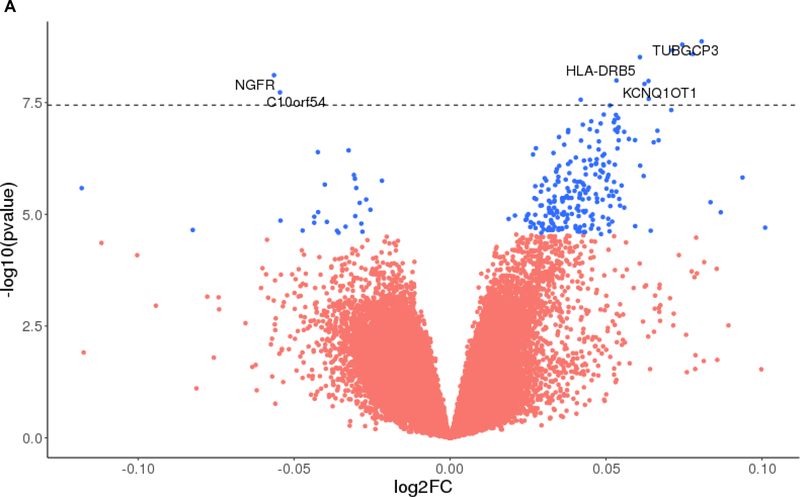
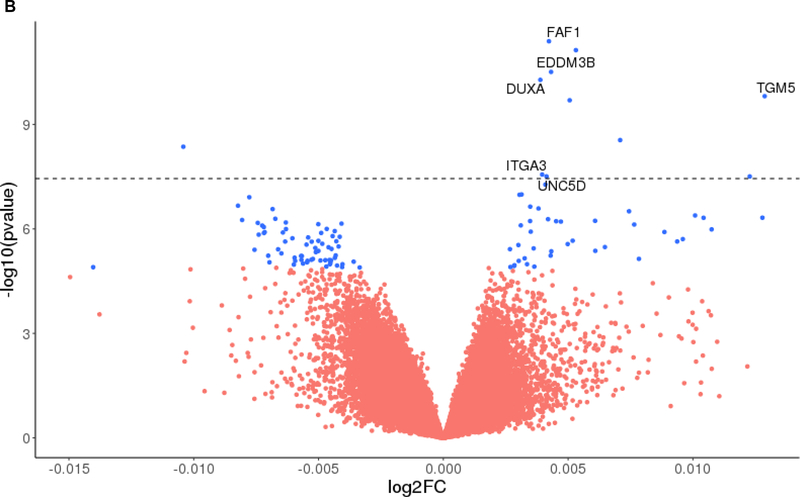
Figure 1.
Volcano plots showing the identified VMPs associated with amyloid plaques (1A) and tangles (1B). The p-values in -log10 scale (Y-axis) are plotted against the log2 fold change (log2FC) of variability with respect to unit increase of the pathological burden (X-axis). A positive log2FC represents hypervariable methylation and a negative log2FC represents hypovariable methylation. The VMPs with q < 0.05 are marked with the blue color and the VMPs with q > 0.05 are marked with red color. The dashed horizontal line represents genome wide significance level α = 3.6 × 10⁻⁸, and the VMPs with < 3.6 × 10⁻⁸ are annotated by genes within ±5kb of the probe.


