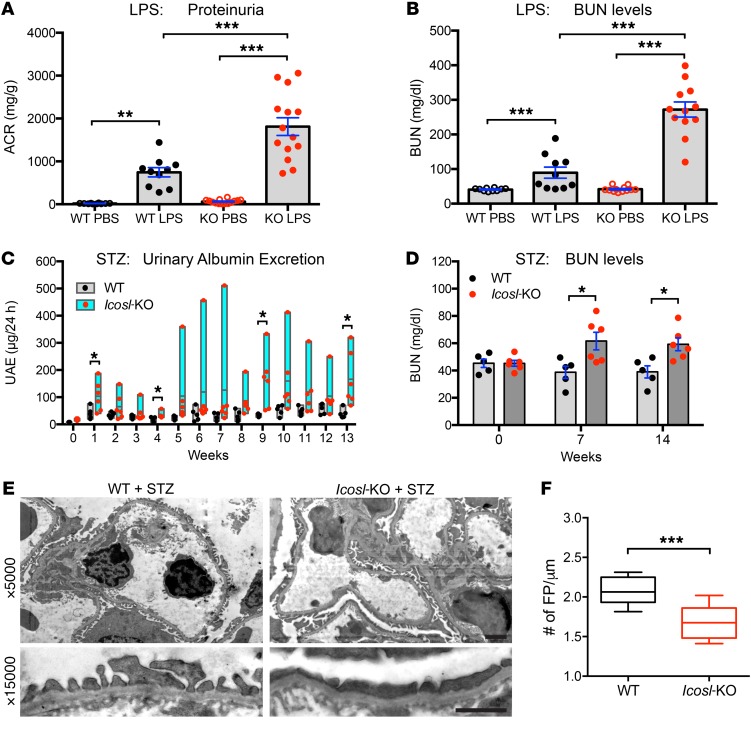
Figure 4. ICOSL plays a protective role during kidney injury.
(A and B), BALB/c WT and Icosl-KO mice were injected with either PBS or LPS (2.5 mg/kg body weight), then urine and blood were collected 24 hours later (n = 10 for WT PBS, n = 10 for WT LPS, n = 14 for KO PBS, n = 14 for KO LPS). (A) Urinary albumin and creatinine were measured using a mouse albumin ELISA kit and a creatinine assay kit, respectively. ACR ratio (mg/g) was calculated and used as a parameter to determine proteinuria. (B) Renal function was evaluated by measuring BUN levels as described in Methods. (C and D) Both BALB/c WT (black dots) and Icosl-KO (red dots) mice developed hyperglycemia after STZ injection (n = 5–6 per group). (C) The floating bar graph indicates urinary albumin excretion levels. (D) BUN levels. (E) Transmission electron microscope (TEM) analysis of PFA-fixed kidney glomeruli from STZ-induced WT and Icosl-KO mice (14 weeks after STZ injection). Top, TEM images displaying capillary loops at ×5000 magnification. Bottom, high magnification of podocyte foot processes (×15,000) highlighting mild effacement in the WT group and more severe effacement in the Icosl-KO group. Scale bars, 2 μm. (F) Quantification of foot process (FP) effacement using the TEM images (E). Boxes and line represent mean ± SEM and whiskers showing minimum and maximum points (n = 10 biological samples per group). Data are mean ± SEM; *P < 0.05, **P < 0.01, ***P < 0.001; 1-way ANOVA with Tukey’s multiple comparison test (A and B) or multiple unpaired t test with the Holm-Sidak comparisons test (C and D) or Student’s 2-tailed, unpaired t test (F).

