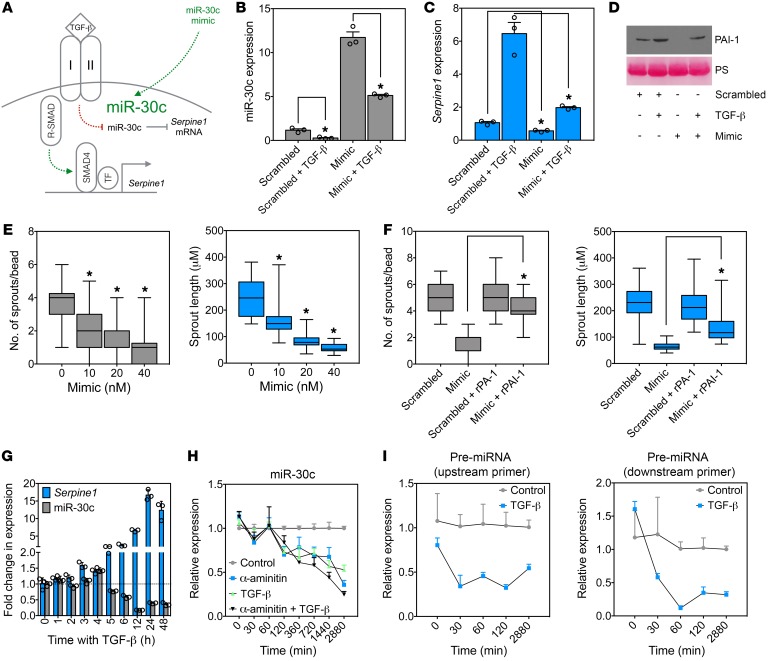
Figure 3. miR-30c mimics block Serpine1 expression and inhibit in vitro EC sprouting.
(A) Two pathways to Serpine1 induction by TGF-β signaling in ECs. (B) qPCR analysis of miR-30c in ECs treated with 10 ng/ml TGF-β, 20 nM miR-30c mimic, or a combination of both. Samples were assayed in triplicate (n = 3). (C) qPCR analysis of Serpine1 in ECs treated with 10 ng/ml TGF-β, 20 nM miR-30c mimic, or the combination. Samples were assayed in triplicate (n = 3). (D) Western blot analysis of PAI-1 in ECs treated with 10 ng/ml TGF-β, 20 nM miR-30c mimic, or a combination of both. Ponceau staining (PS) was used to show equal loading. (E) Fibrin bead–sprouting assay in ECs treated with miR-30c mimic for 72 hours (n = 30 beads). Controls were treated with a 40-nM scrambled sequence. (F) Number and length of sprouts in ECs treated with miR-30c mimic, rPAI-1 (0.8 μg/ml), or a combination of both for 72 hours (n = 30 beads). (G) qPCR analysis of ECs treated with 10 ng/ml TGF-β for each indicated time point. Samples were assayed in triplicate (n = 3). (H) qPCR analysis of ECs treated with 10 ng/ml TGF-β, 10 μM α-amanitin, or a combination of both. Samples were assayed in triplicate (n = 3). (I) qPCR analysis of pre-miRNA for miR-30c in ECs treated with 10 ng/ml TGF-β for the indicated durations. Samples were assayed in triplicate (n = 3). *P < 0.05, by Student’s t test (B and C), ANOVA (E), and Student’s t test (F). Data represent the mean ± SEM.

