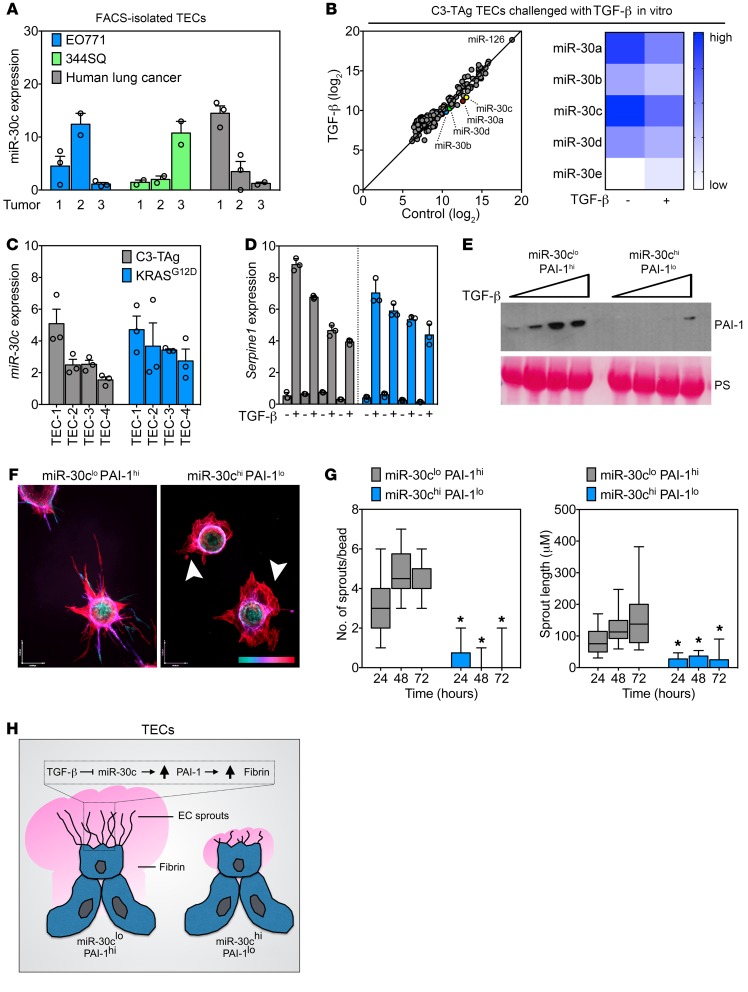
Figure 5. Heterogeneous tumor–associated ECs show a spectrum of miR-30c and Serpine1 expression that defines their in vitro sprouting abilities.
(A) qPCR analysis of FACS-enriched TECs from orthotopic E0771 mammary tumors, orthotopic 344SQ lung tumors, and human lung tumor specimens. Samples were assayed in triplicate (n = 3 tumors). (B) PCA of NanoString array using TECs treated with 10 ng/ml TGF-β for 48 hours. A heatmap of miR-30 family members is also shown. (C) qPCR analysis of individual isolates of TECs from the indicated murine tumor model. Samples were assayed in triplicate (n = 3). (D) qPCR analysis in C3-TAg TECs or KRASG12D TECs treated with 10 ng/ml TGF-β for 48 hours. Samples were assayed in triplicate. Samples are arranged from low (far left) to high (far right) miR-30c expression on the graph (n = 3). (E) Western blot analysis of PAI-1 using conditioned media from miR-30clo PAI-1hi and miR-30chi PAI-1lo ECs treated with TGF-β (0, 1, 5, and 10 ng/ml for 48 hours). PS was used to show equal loading. (F) Images of miR-30clo PAI-1hi and miR-30chi PAI-1lo ECs in a fibrin-sprouting assay. Arrowheads indicate aberrant sprout formation in miR-30chi PAI-1lo ECs. The scale at bottom right indicates sprout depth in the 3D fibrin matrix. Scale bar: 40 μm (x) and 54 μm (y). (G) Number of sprouts and length of sprouts per bead in miR-30clo PAI-1hi and miR-30chi PAI-1lo ECs. Sprouts were counted at the indicated time points (n = 30 beads per time point). *P < 0.05, by ANOVA. (H) Schematic of TEC subtypes showing angiogenic (miR-30clo PAI-1hi) versus dysmorphic (miR-30chi PAI-1lo) TECs identified in this study. Data represent the mean ± SEM.

