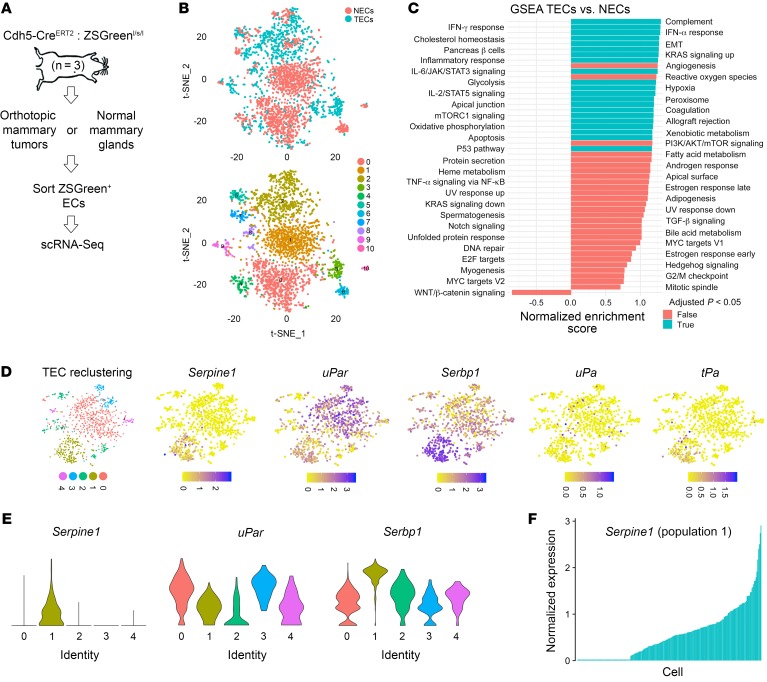
Figure 6. Identification of Serpine1-enriched TEC subpopulations in vivo using scRNA-Seq.
(A) Experimental design for isolating ZSGreen+ NECs or TECs for scRNA-Seq. E0771 mammary tumors or normal mammary glands were harvested (from the contralateral side, n = 3 individual mice), pooled, and subjected to 10X Genomics scRNA-Seq. (B) t-SNE plots showing clustering of NECs versus TECs. (C) GSEA showing hallmark pathways in TECs versus NECs as determined from scRNA-Seq data. (D) TEC reclustering and t-SNE plots showing enrichment and expression of 5 coagulation and fibrinolysis genes in TEC subpopulations. Serpine1 expression was mostly restricted to population 1. (E) Violin plots showing differential enrichment of Serpine1, uPar, and Serbp1 across 5 TEC subpopulations. (F) Serpine1 expression by individual cell in TEC subpopulation 1 showing a spectrum of Serpine1.

