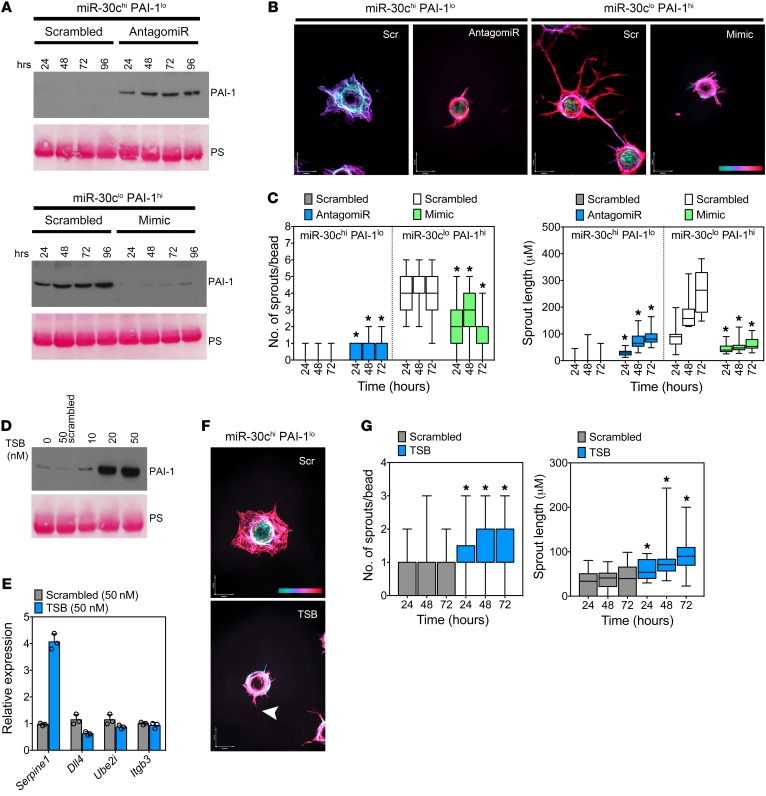
Figure 7. The balance between miR-30c and Serpine1 controls vascular-directed fibrinolysis and angiogenesis.
(A) Western blot for PAI-1 using conditioned media from miR-30chi PAI-1lo ECs treated with 20 nM miR-30c antagomiR or miR-30clo PAI-1hi ECs treated with 20 nM miR-30c mimic. Cells were treated for the indicated durations before harvesting the culture medium. (B) Representative images of vascular structures (fibrin bead assay) in miR-30chi PAI-1lo ECs treated with 20 nM miR-30c antagomiR and in miR-30clo PAI-1hi ECs treated with 20 nM miR-30c mimic. Images were captured after 48 hours. The scale at bottom right indicates sprout depth in the 3D fibrin matrix. Scale bars: 40 μm (x) and 54 μm (y). (C) Number of sprouts per bead and average sprout length of miR-30chi PAI-1lo ECs treated with 20 nM miR-30c antagomiR and miR-30clo PAI-1hi ECs treated with 20 nM miR-30c mimic. Sprouts were counted and measured at the indicated time points (n = 30 beads per condition). Results were analyzed using ANOVA. (D) Western blot using conditioned media from miR-30chi PAI-1lo ECs treated with the indicated doses of TSB for 48 hours. PS was used to show equal loading. (E) qPCR for other miR-30c targets in TSB-treated ECs. Samples were assayed in triplicate. (F) Representative images of vascular structures (fibrin bead assay) in miR-30chi PAI-1lo ECs treated with 20 nM TSB or 20 nM scrambled TSB control. Images were captured after 48 hours. Arrowhead indicates an EC sprout. Color scale indicates sprout depth in the 3D fibrin matrix. Scale bars: 40 μm (x) and 54 μm (y). (G) Number of sprouts per bead and average sprout length in miR-30chi PAI-1lo ECs treated with 20 nM TSB or 20 nM scrambled TSB control (n = 30 beads per condition). *P < 0.05, by ANOVA (C and G). Data represent the mean ± SEM.

