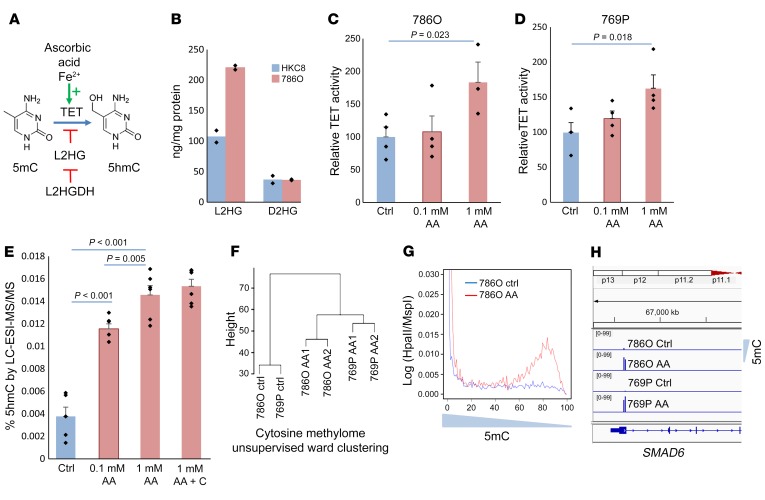
Figure 4. AA leads to increased TET activity and 5hmC levels in ccRCC cells.
(A) Schematic showing the role of AA as an essential cofactor for TET enzymatic activity. (B) Intracellular L2HG levels measured by MS in ccRCC cell line 786-O are much higher than in the immortalized normal kidney cell line HKC8 (n = 2). (C and D) TET activity was measured in vitro with AA-treated RCC cells (769-P and 786-O) and was increased after treatment. t test, P values as indicated. Data are shown as mean ± SEM with individual data points overlaid (n = 2). Exposure time was 4 hours, mimicking bioavailability curves with i.v. AA, followed by 24-hour incubation with fresh media prior to harvesting the cells for nuclear extraction and TET activity analysis. We adjusted for multiple comparisons by dividing the significance level by the number of comparisons performed via Bonferroni’s correction. Hypotheses were deemed significant if P values were lower than 0.025 (0.05/2 to account for multiple comparisons). (E) 5hmC was measured by LC-ESI-MS/MS and was significantly increased after AA treatment of RCC cells 769-P. Addition of catalase did not change the percentage of 5hmC. t test, P values as indicated. Data are shown as mean ± SEM with individual data points overlaid (n = 2). We adjusted for multiple comparisons by dividing the significance level by the number of comparisons performed via Bonferroni’s correction. Hypotheses were deemed significant if P values were lower than 0.0125 (0.05/4 to account for multiple variations). (F) Unsupervised clustering based on genome-wide methylation analysis conducted by HELP assay. Ward clustering shows global methylation changes are induced by AA treatment. (G) Histograms based on methylation (log [HpaII/MspI]) show increased hypomethylation after AA treatment. (H) Smad6 promoter becomes demethylated after AA treatment in both 786-O and 769-P ccRCC cells.

