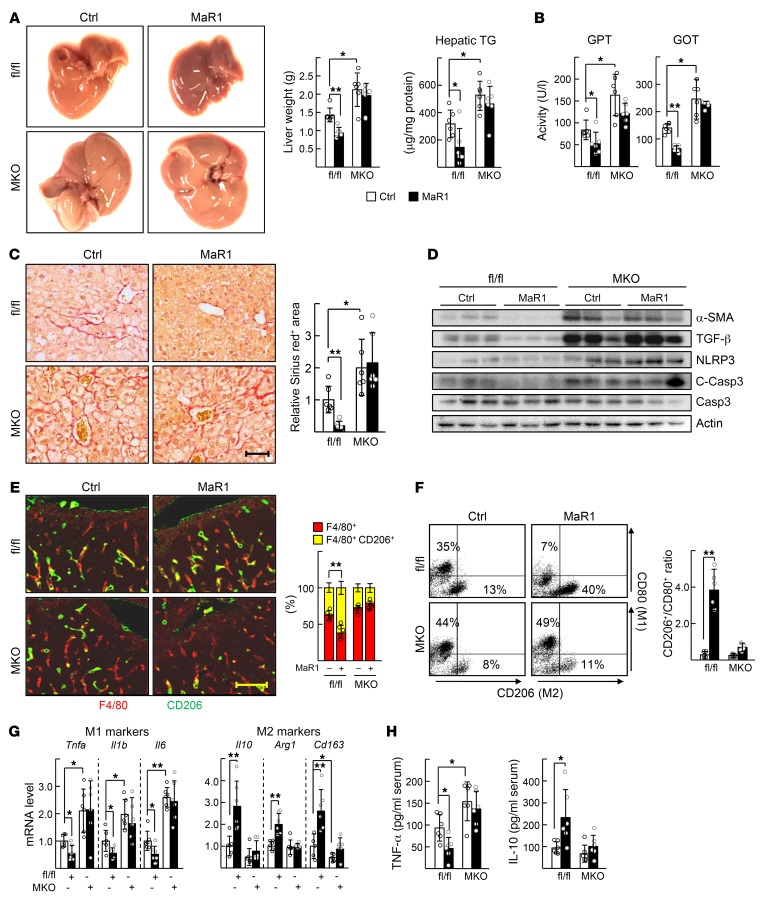
Figure 5. MaR1 improves the HFD-induced NASH in a RORα-dependent manner.
Seven-week-old floxed and RORα-MKO mice were fed with HFD for 12 weeks. After 10 weeks of diet feeding, MaR1 was i.p. injected daily at dose of 5 μg/kg BW for 2 weeks. (A) Representative captured livers (left), the liver weights (center), and hepatic TG levels of mice at the end of experiments (right). (B) Serum GPT and GOT activities were analyzed at the end of experiments. (C) Sirius red staining of liver sections (left). Fibrotic area in the liver sections was analyzed by Image J (right). Scale bar: 50 μm. (D) Levels of α-SMA, TGF-β, NLRP3, and cleaved caspase-3 (C-Casp3) proteins in the liver were analyzed by Western blotting. (E) The expression of F4/80 and CD206 was visualized by red and green immunofluorescence in liver sections (left). The percentage of CD206+ F4/80+ cells was determined by Image J (right). Scale bar: 50 μm. (F) The CD206+/CD80+ ratio of F4/80+ cells was determined by flow cytometry (right). Representative dot plots were shown (left). (G) Hepatic mRNA levels of the M1 and M2 marker genes were measured by qRT-PCR. (H) The concentrations of TNF-α and IL-10 in serum were measured by ELISA. *P < 0.05 and **P < 0.01 (n = 5–6) for A–H. The data represent mean ± SD. Data were analyzed by Mann–Whitney U test for simple comparisons or Kruskal-Wallis test for multiple groups.

