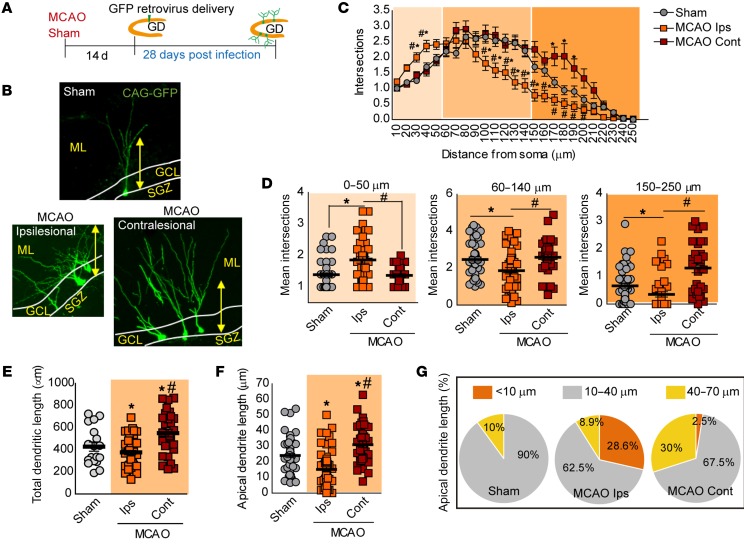
Figure 5. Altered features of newborn neurons induced by stroke.
(A) Experimental design for GFP retroviral labeling of newborn neurons. (B) Representative images of GFP newborn neurons of each group. Yellow arrow, 112 μm. (C) Sholl analysis of GFP newborn neurons in sham-operated and MCAO groups, 28 days after infection. Two-way ANOVA demonstrates a significant interaction between distance and experimental group in the number of intersections (F(48,3022) = 5.18; P < 0.0001; Bonferroni’s post hoc: *P < 0.05 vs. sham operated; #P < 0.05 vs. MCAO ipsilesional; sham operated, n = 52 neurons/4 mice; MCAO ipsilesional, n = 41 neurons/4 mice; MCAO contralesional, n = 32 neurons/3 mice). (D) Mean average intersections of GFP neurons at different intervals from soma. (*P < 0.05 vs. sham operated; #P < 0.05 vs. MCAO ipsilesional; sham operated, n = 52 neurons/4 mice; MCAO ipsilesional, n = 41 neurons/4 mice; MCAO contralesional, n = 32 neurons/3 mice). (E and F) Quantification of total dendritic length (E, *P < 0.05 vs. sham operated; #P < 0.05 vs. MCAO ipsilesional, respectively; sham operated, n = 18 neurons/4 mice; MCAO ipsilesional, n = 45 neurons/4 mice; MCAO contralesional, n = 29 neurons/3 mice), and apical dendritic length (F, *P < 0.05 vs. sham operated; #P < 0.05 MCAO vs. ipsilesional; sham operated, n = 61 neurons/4 mice; MCAO ipsilesional, n = 60 neurons/4 mice; MCAO contralesional, n = 40 neurons/3 mice) in sham-operated and both ipsi- and contralesional sides of MCAO group. (G) Pie charts display percentage of GFP+ neurons in each group showing apical dendrite lengths of less than 10 μm, 10–40 μm, and more than 40 μm (sham operated, n = 61 neurons/4 mice; MCAO ipsilesional n = 60 neurons/4 mice; MCAO contralesional, n = 40 neurons/3 mice). Data are represented as mean ± SEM. Data were compared by using nonparametric 2-tailed Mann-Whitney U tests (D–F) and nonparametric 2-way ANOVA followed by Bonferroni’s post hoc testing (C).

