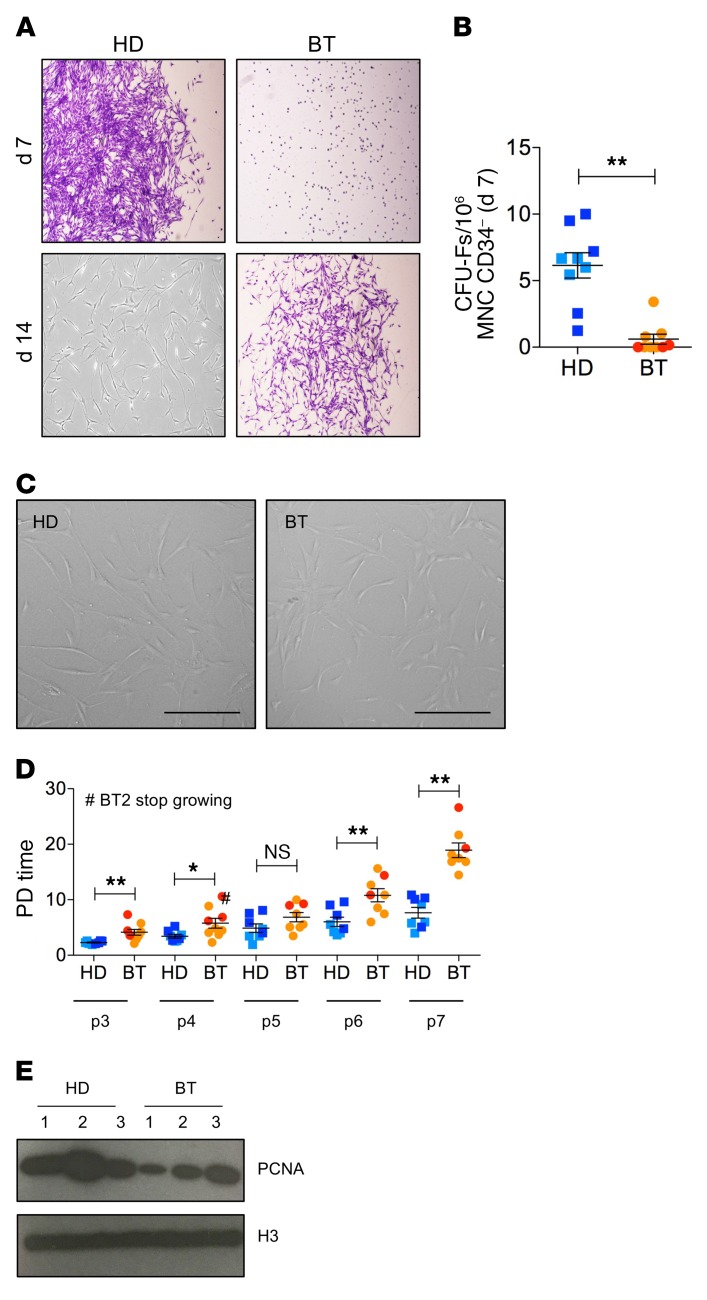
Figure 1. Clonogenic capacity, morphology, and proliferation ability of HD- and BT-MSCs.
(A) Representative images of fibroblast colony-forming units (CFU-Fs) stained with crystal violet at 7 and 14 days after plating CD34– MNCs purified from BM samples of BT patients and HD controls. Original magnification, ×4. (B) CFU assay for HD-MSCs (n = 9) and BT-MSCs (n = 8). Results are expressed as number of colonies per 106 CD34– MNCs. Error bars show mean ± SEM. (C) Representative examples of in vitro–expanded MSC morphology obtained from HD and BT samples. Scale bars: 200 μM. (D) Population doubling (PD) time of HD-MSCs (n = 8) and BT-MSCs (n = 8) calculated from passage 3 (p3) to p7. Error bars show mean ± SEM. #Indicates the BT sample, which stopped growing at p4. (E) Western blot analysis of PCNA expression on nuclear protein extracts isolated from 3 different HD- and BT-MSCs. H3 antibody was used for normalization. In all panels, each square represents one HD sample (blue: >18 years; light blue: <18 years). Each circle represents one BT sample (red: >18 years; orange: <18 years). P values were determined by Student’s t test (*P < 0.05; **P < 0.001).

