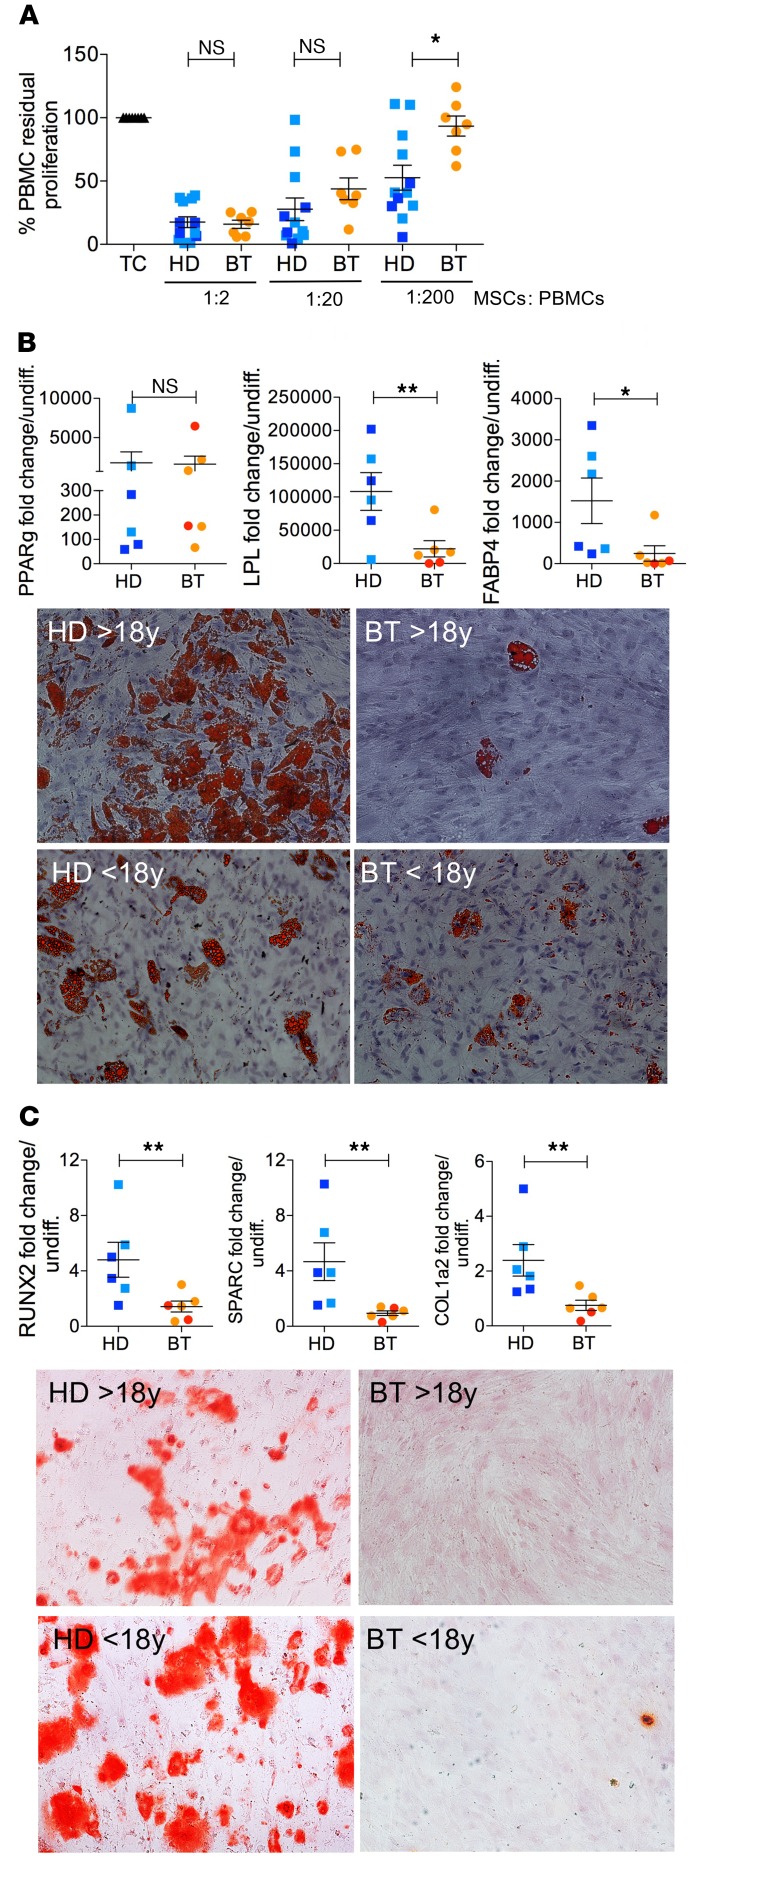
Figure 2. Functional characterization of HD- and BT-MSCs.
(A) The in vitro immunomodulatory effect of HD- and BT-MSCs on human healthy donor PBMCs in an allogenic setting. The graph shows the percentage of residual proliferation of PHA-stimulated PBMCs either in absence (TC) or presence of HD- or BT-MSCs at different ratios (1:2, 1:20, and 1:200), calculated by measuring 3H-thymidine incorporation after 72 hours of coculture. We referred to PBMC proliferation in the absence of MSCs as 100%, and this percentage was used to normalize PBMC proliferation in the presence of MSCs. Each error bar show mean ± SEM (HD: n = 12; BT: n = 7). (B) Expression of early (PPARg) and late (LPL, FABP4) adipogenic genes in HD- and BT-MSCs induced to differentiate in proper adipogenic medium for 21 days (upper panel). Results are expressed as fold change relative to undifferentiated MSCs (HD: n = 6; BT: n = 6). Each error bar shows mean ± SEM. Representative images of differentiated HD- and BT-MSCs stained with Oil Red O (lower panel, original magnification ×10). (C) Real-time PCR for early (RUNX2) and late (SPARC, COL1A2) osteogenic gene expression in HD- and BT-MSCs induced to differentiate in proper osteogenic medium for 21 days (upper panel). Each error bar shows mean ± SEM of gene expression as fold change relative to undifferentiated MSCs (HD: n = 6; BT: n = 6). Representative images of differentiated HD- and BT-MSCs stained with Alizarin Red S (lower panel, original magnification ×10). In all panels, each square represents one HD sample (blue: >18 years; light blue: <18 years). Each circle represents one BT sample (red: >18 years; orange: <18 years). P values were determined by Student’s t test (*P < 0.05; **P < 0.001).

