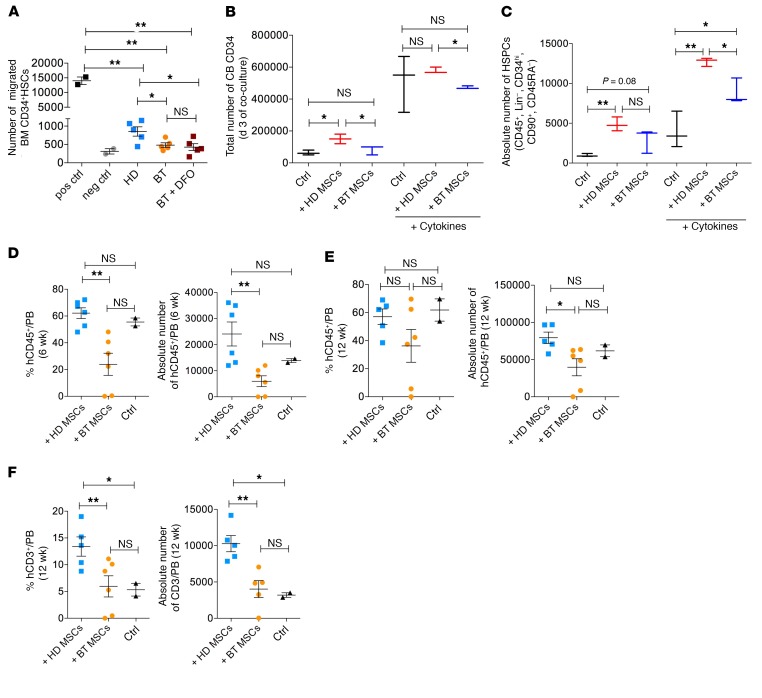
Figure 8. Impaired hematopoietic supportive capacity of BT-MSCs.
(A) Transwell migration assay of cord blood (CB) CD34+ toward HD-MSCs (n = 5; blue squares), BT-MSCs (n = 5; orange circles), and BT-MSCs (purple squares) treated with 100 μM DFO for 24 hours. Migration capacity is represented as absolute number of CD45+ cells migrated into the bottom chamber. Positive control (pos ctrl): SDF-1 (100 ng/ml). Negative control (neg ctrl): basal medium. Each error bar shows mean ± SEM. (B) Total number of live cord blood (CB) CD34+ cells after 3 days of coculture with HD-MSCs (red) and BT-MSCs (blue) in the presence or absence of proper cytokines. CB CD34+ cells cultured for 3 days in the presence or absence of proper cytokines were used as control (black). Data are mean ± SEM (HD: n = 3; BT: n = 3). (C) Absolute number of primitive HSPCs identified as Lin–, CD34hi, CD90+, CD45RA– on CD45+ cells after 3 days of coculture with HD-MSCs (red) and BT-MSCs (blue) in the presence or absence of proper cytokines. CB CD34+ cells cultured alone in the presence or absence of proper cytokines were used as control (black) (HD: n = 3; BT: n = 3). (D) Percentage (left panel) and absolute number (right panel) of human CD45+ cells detected in the peripheral blood of NSG mice 6 weeks after intra tail vein coinfusion of 2.5 × 10⁵ human CB CD34 with 1 × 10⁶ HD- or BT-MSCs. (E) Percentage (left panel) and absolute number (right panel) of human CD45+ cells detected in the peripheral blood of NSG mice at a later time point (12 weeks). (F) Percentage (left panel) and absolute number (right panel) of human T lymphocytes (CD3+) detected in the peripheral blood of NSG mice 12 weeks after transplantation. Mice transplanted with CB CD34+ cells alone were used as controls. Data are mean ± SEM. In all panels, each dot represents an irradiated mouse transplanted with CB CD34+ + HD-MSCs (light blue), CB CD34+ + BT-MSCs (orange), or CB CD34+ (black). P values were determined by Student’s t test (*P < 0.05; **P < 0.001).

