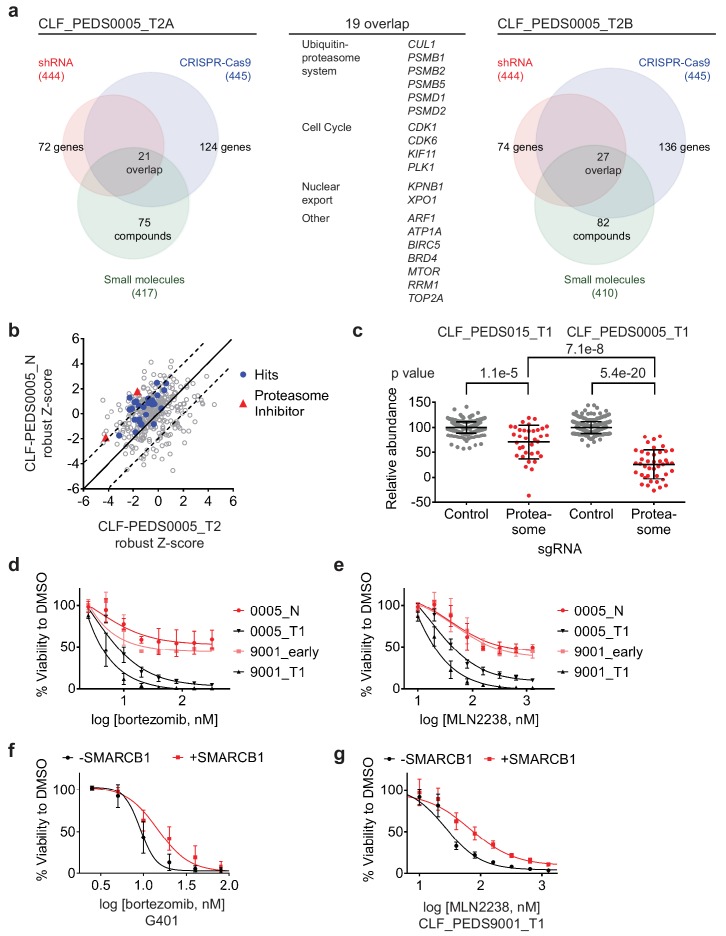
Figure 3. Functional genomic screens identify inhibition of the proteasome as a vulnerability in RMC.
(a) Left: RNAi suppression of 444 evaluable genes (red) identifies 72 genes that when suppressed caused a significant viability loss in CLF_PEDS0005_T2A. Genomic indels created by CRISPR-Cas9 in 445 evaluable genes (blue) identify 124 genes that cause a viability loss. RNAi and CRISPR-Cas9 screens were performed in biological replicates. Small-molecule screen (performed in technical replicates) with 417 evaluable compounds (green) identifies 75 compounds that lead to significant viability loss. 21 genes overlap across these three screens. Right: The same screens were performed with CLF_PEDS0005_T2B and 27 genes were found to be significantly depleted when suppressed by RNAi, genomically deleted by CRISPR-Cas9 or inhibited when treated with a small molecule. Center: List of 19 genes that overlapped between functional screens from CLF_PEDS0005_T2A and CLF_PEDS0005_T2B can be categorized into genes involving the ubiquitin-proteasome system, cell cycle and nuclear export (Supplementary file 7). (b) Comparison of Z-score normalized small-molecule screens between CLF_PEDS0005_T2 and CLF_PEDS0005_N (normal isogenic cell line). Small molecules targeting the genes identified in Figure 3a are either in red (proteasome inhibitors) or blue (other hits). Each dot is representative of the average of two technical replicates. (c) Relative log2 fold change in abundance from CRISPR-Cas9 screens between sgRNA controls (grey) and genes in the DCT v1.0 screen involving the proteasome (red). Data is taken at 23 days following selection and compared to an early time point. As compared to the undifferentiated sarcoma cell line CLF_PEDS015_T1, inhibition of the proteasome subunits leads to a more profound viability loss as compared with controls. Each dot is representative of a minimum of 2 biological replicates. (d) Short term cultures of the normal cell line (CLF_PEDS0005_N) or early passage of the heterogenous cell line (CLF_PEDS9001_early) were compared for assessment of viability to the primary tumor cell lines following treatment with bortezomib. Two-tailed t-test p-value=0.008 for PEDS0005_T1 and two-tailed t-test p-value=4.76e-5 for PEDS9001_T1. Error bars represent standard deviations from two biological replicates. (e) Short term cultures of the normal cell line (CLF_PEDS0005_N) or early passage of the heterogenous cell line (CLF_PEDS9001_early) were compared for assessment of viability to the primary tumor cell lines following treatment with MLN2238. Error bars represent standard deviations from two biological replicates. (f) Re-expression of SMARCB1 in G401 leads to a rightward shift in the dose-response curve with bortezomib compared with uninduced cells. Error bars represent standard deviations from two biological replicates. (g) Re-expression of SMARCB1 in CLF_PEDS9001_T leads to a rightward shift in the dose-response curve with MLN2238 compared with uninduced cells. Error bars represent standard deviations from three biological replicates.


