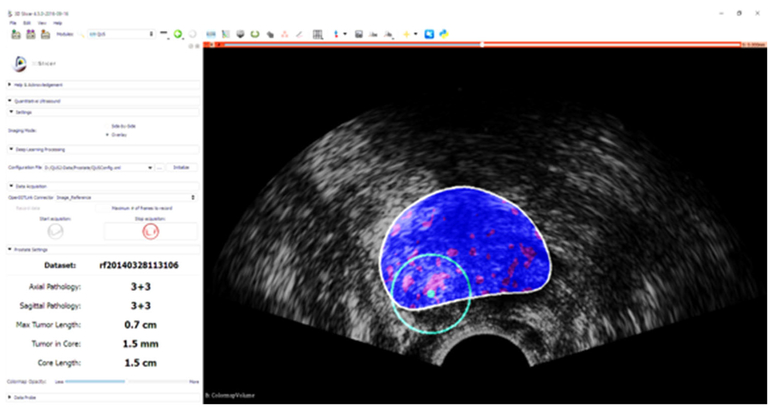
Fig. 4.
Guidance interface implemented as part of a 3D Slicer module: cancer likelihood map is overlaid on B-mode ultrasound images. Red indicates predicted labels as cancer, and blue indicates predicted benign regions. The boundary of the segmented prostate is shown with white, and the green circle is centered around the target location which is shown in green dot

