
Fig. 1. Gambian children maintain highly characteristic hepcidin levels over 12 weeks of study.
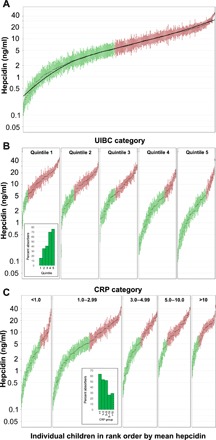
(A) Twelve-week geometric mean hepcidin values (±SE) for individual children put in rank order from lowest to highest. Individual means and the smoothed curve for all children are shown in black. Data illustrated are for all 388 children with more than six serial measurements. Green indicates habitual iron absorbers (hepcidin <5.5 ng/ml); red indicates habitual iron blockers (hepcidin >5.5 ng/ml). (B) Data from (A) are recategorized according to quintiles of UIBC. UIBC concentrations: Q1, 33.7 to 52.4 μM; Q2, 52.4 to 59.3 μM; Q3, 59.3 to 66.8 μM; Q4, 66.8 to 74.3 μM; Q5, 74.3 to 120 μM. Green indicates habitual iron absorbers (hepcidin <5.5 ng/ml); red indicates habitual iron blockers (hepcidin >5.5 ng/ml). The proportion of iron absorbers in each quintile is indicated in the inset panel and was as follows: Q1, 15.6%; Q2, 35.5%; Q3, 40.8%; Q4, 69.7%; Q5, 76.0%. (C) Data from (A) are recategorized according to clinical categories of CRP (mg/liter). Green indicates habitual iron absorbers (hepcidin <5.5 ng/ml); red indicates habitual iron blockers (hepcidin >5.5 ng/ml). The proportion of iron absorbers in each group is indicated in the inset panel: CRP <1, 63.3%; CRP 1 to 3, 53.6%; CRP 3 to 5, 52.2%; CRP 5 to 10, 26.5%; CRP >10, 29.2%.