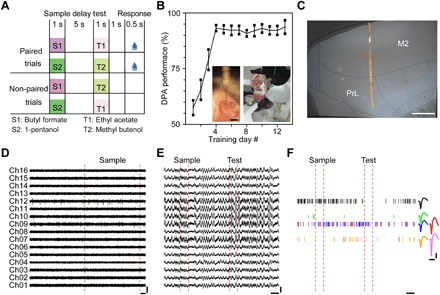
Fig. 2. Recordings by Neurotassels during DPA tasks.

(A) Schematic of the olfactory DPA task. (B) Performance of mice trained with the DPA task. Insets: An implanted 16-channel Neurotassel (left) and a mouse with an implanted Neurotassel in the mPFC (right). Error bars represent SD around the mean (n = 6). Scale bar, 1 mm (inset). (Photo credit: Xiaowei Gu at ION). (C) Microphoto of a 200-μm-thick brain slice with an implanted Neurotassel. The mouse brain was sliced in sagittal direction and parallel to the implanted Neurotassel. Anatomical borders were identified according to the stereotaxic atlas of Paxinos and Watson (2001). Scale bar, 500 μm. (D) Extracellular AP traces (250 to 8000 Hz) recorded by a 16-channel Neurotassel implanted in the mPFC of M04. Scale bars, 200 μV (vertical), 100 ms (horizontal). (E) LFP traces (0.5 to 200 Hz) during a task trial. Scale bars, 300 μV (vertical), 1 s (horizontal). (F) Spike rasters of isolated neurons during a task trial. Scale bars, 50 μV (vertical), 1 s and 1 ms (horizontal; left and right, respectively).
