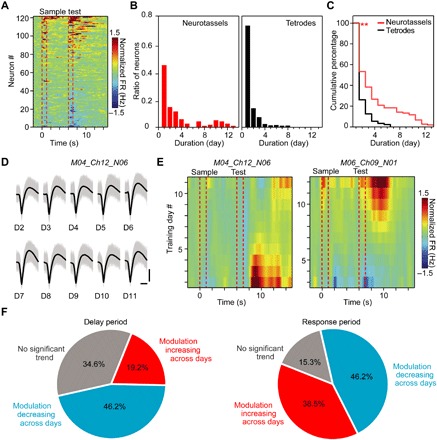
Fig. 3. Recording stability during DPA tasks.

(A) Heat map of normalized firing rates (FRs) for the recorded neurons by Neurotassels during training. Each row represents the baseline-normalized firing rate of one neuron. The dashed red lines represent the onsets and offsets of odor delivery. (B) Distribution of neurons according to the continuously recorded duration days by Neurotassels (left) and microwire tetrodes (right), respectively. One hundred twenty-one (121) neurons were recorded by six Neurotassels from six mice, and 730 neurons were recorded by 256 tetrodes from eight mice. Each tetrode was constructed by twisting four PI-insulated, Ni-Chrome wires with a 12.5-μm-diameter core. (C) Cumulative distribution of the percentage of neurons as a function of recording duration showing significant increases in recording of Neurotassels (red line) compared with that of tetrodes (black line) (**P < 0.01, Kolmogorov-Smirnov test). (D) The waveforms of an example neuron stably recorded during the training process. Scale bars, 50 μV (vertical), 0.5 ms (horizontal). (E) Heat map of the normalized firing rate for two example neurons. Each row represents the baseline-normalized firing rate of one training day. (F) Percentage of neurons with an increase or a decrease in firing through training during the delay (left) and response (right) periods, respectively. Twenty-six (26) neurons that were continuously recorded for longer than 5 days were considered here.
