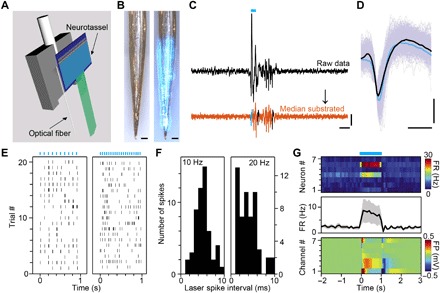
Fig. 4. Simultaneous optogenetic stimulation and electrical recordings.

(A) Schematic of elastocapillary self-assembly of a Neurotassel on a sharpened optical fiber. (B) A 61-channel Neurotassel assembled on a sharpened optical fiber without (left) and with (right) light, respectively. Scale bars, 100 μm. (C) Black: Potential trace for a single trial with optogenetic transients at onset and offset of laser stimulation. Orange: Potential trace after subtraction of the median. Scale bars, 0.1 mV (vertical), 10 ms (horizontal). (D) Average waveforms of light-evoked (blue) and spontaneous (black) spikes. Scale bars, 50 μV (vertical), 0.5 ms (horizontal). (E) Raster plots of evoked spike firing of an example neuron by 10-Hz (left) and 20-Hz (right) 5-ms laser stimulation (marked by blue bars). (F) Distribution of spike jitter from laser as measured by the delay from stimulation onset to the first evoked spikes during the 10-Hz (left, total 200 pulses) and 20-Hz (right, total 400 pulses) stimulation. (G) Top: Heat map of firing rates of seven neurons in response to 1-s laser stimulation. Middle: Averaged firing rate of the neurons. Bottom: Heat map of field potentials at the recording sites of the neurons.
