
Fig. 5. Chronic stability of implanted Neurotassels.
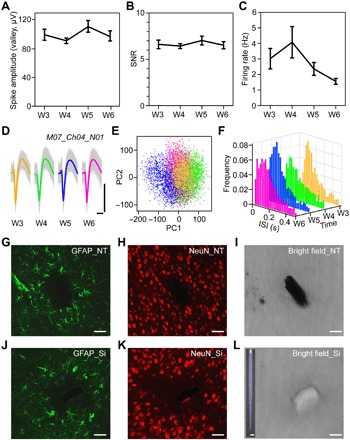
(A to C) Average spike amplitude, SNR, and firing rate of all sortable neurons recorded by Neurotassels from 3 to 6 weeks after implantation. Error bars represent SD around the mean. (D) Aligned and average spike waveforms recorded by a microelectrode of a 16-channel Neurotassel from 3 to 6 weeks after implantation. Scale bars, 100 μV (vertical), 1 ms (horizontal). (E) PCA of all waveforms in (D). (F) Time evolution of ISI histograms. Bin size, 20 ms. (G to L) Immunohistochemical staining and bright-field images of a horizontal brain slice after 5-week implantation of a Neurotassel and a silicon probe, respectively. The 100-μm-thick slice was labeled for astrocytes [glial fibrillary acidic protein (GFAP), green] and neurons (NeuN, red). Inset: A silicon probe with a cross-section of 100 × 30 μm2. Scale bars, 50 μm (G to L), 100 μm (L, inset).