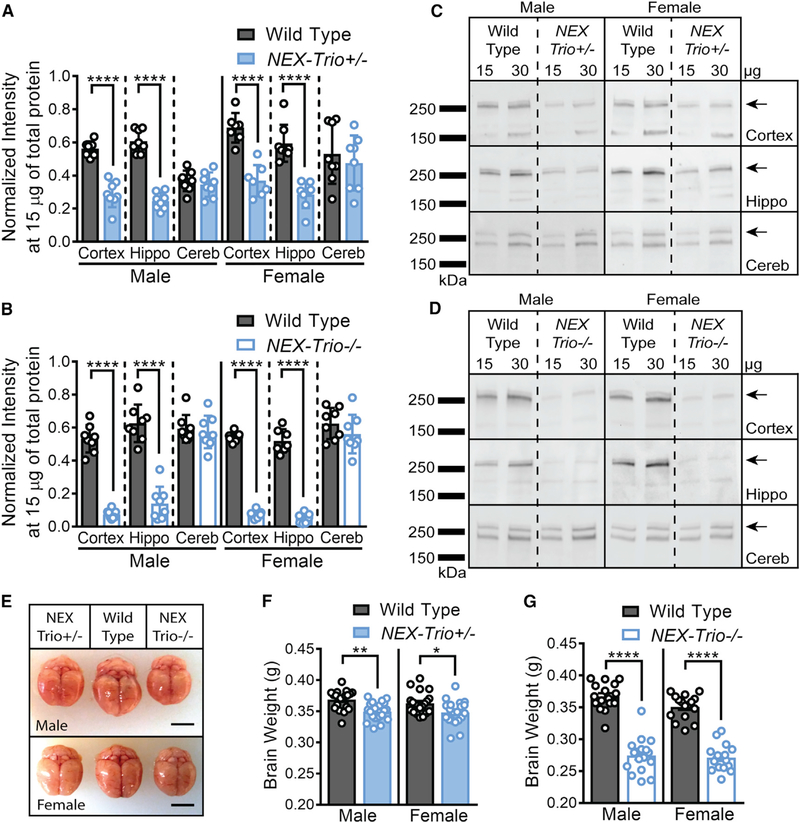
Figure 1. NEX–Trio+/− and NEX–Trio−/− Mice Have Smaller Brains and Reduced TRIO Levels in the Cortex and Hippocampus at P42.
(A and B) TRIO levels were reduced in the cortex and hippocampus (Hippo) of NEX–Trio+/− (A) and NEX–Trio−/− (B) mice of both sexes at P42. No change was observed in the cerebellum (Cereb). Repeated–measures (RM) two–way ANOVA of genotype and brain region with post hoc Bonferroni multiple comparisons (Bonf MC) test identified differences for each group (n = 7–8 littermate pairs).
(C and D) Representative immunoblots are shown for male and female NEX–Trio+/− (C) and NEX–Trio−/− (D) mice in the cortex, hippocampus, and cerebellum. The overlapping 268– and 289–kDa bands, representing TRIO9S/L, were quantified (arrows). Other bands represent nonspecific antibody interactions or other isoforms (Katrancha et al., 2017).
(E–G) Total brain weight (E; scale bars represent 0.5 cm) was reduced in NEX–Trio+/− (F) and NEX–Trio−/− (G) mice compared to WT mice of the same sex at P42.
RM two–way ANOVA with post hoc Bonf MC test identified differences (n = 16–21 mice per genotype).
See also Figure S1. Data are represented as mean ± SEM (*p < 0.05; **p < 0.01; ****p < 0.0001).

