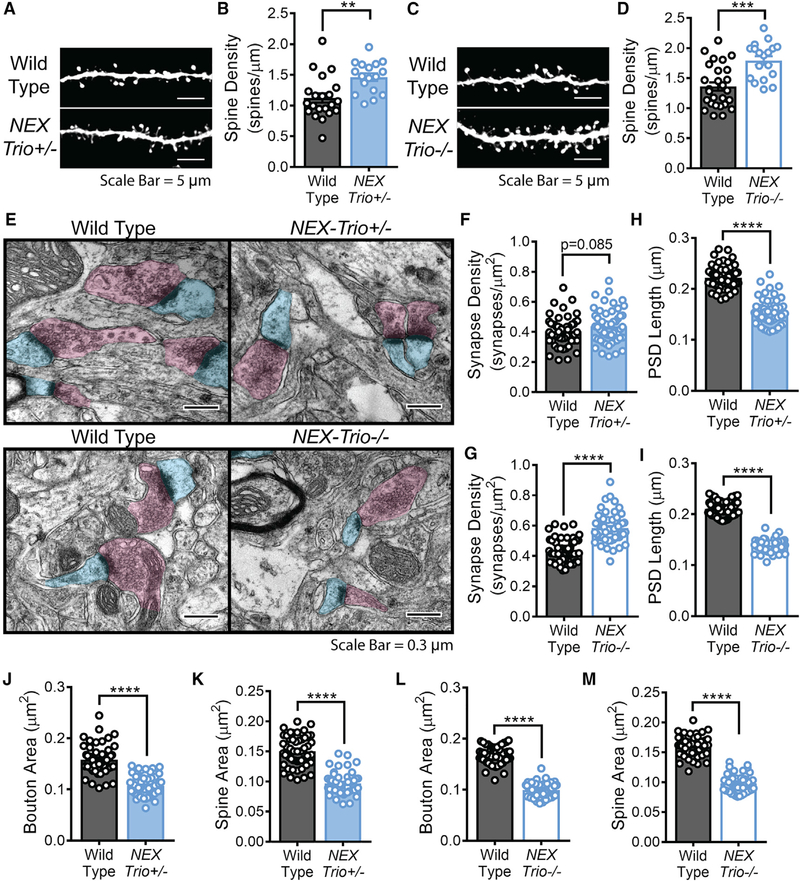
Figure 5. NEX–Trio+/− and NEX–Trio−/− Mice Have Increased Dendritic Spine Density and Smaller Synapses in the Motor Cortex.
(A and C) Representative basal dendrite segments from L5 PNs in the motor cortex of NEX–Trio+/− (A) and NEX–Trio−/− (C) mice with WT controls. Scale bars represent 5 mm.
(B and D) Dendritic spine density was increased on L5 PNs in the motor cortex of NEX–Trio+/− (B) and NEX–Trio−/− (D) mice relative to WT controls. A linear regression with post hoc Bonf MC test identified differences (n = 17–27 dendrite segments from R3 mice per group).
(E) Representative electron micrographs from L5 motor cortex of NEX–Trio+/−, NEX–Trio−/−, and WT mice. Scale bars represent 0.3 μm.
(F and G) Cortical synapse density (synapses per mm ) trended (p = 0.085) toward an increase in NEX–Trio+/− mice (F) and was increased in NEX–Trio−/− mice (G).
(H and I) PSD length was decreased in L5 motor cortex of both NEX–Trio+/− (H) and NEX–Trio−/− (I) mice.
(J and L) Presynaptic bouton area was decreased in L5 motor cortex of both NEX–Trio+/− (J) and NEX–Trio−/− (L) mice.
(K and M) Dendritic spine area was decreased in both NEX–Trio+/− (K) and NEX–Trio−/− (M) mice. For (F)–(M), a linear regression with post hoc Bonf MC test identified differences (n = 54 fields of view [55 μm2 each] from 3 mice per group).
See also Figure S6. Data are represented as mean ± SEM (**p < 0.01; ***p < 0.001; ****p < 0.0001).

