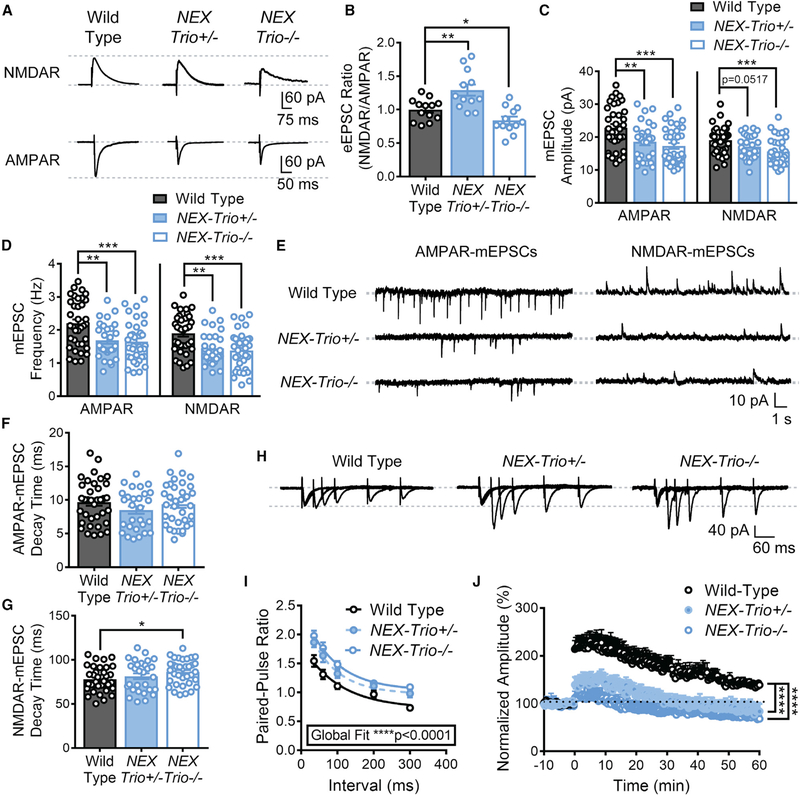
Figure 6. NEX–Trio+/− and NEX–Trio−/− Mice Exhibit Deficits in Pre– and Postsynaptic Function and Synaptic Plasticity.
(A) Representative traces of NMDAR– and AMPAR–eEPSCs from NEX–Trio+/−, NEX–Trio−/−, and WT L5 PNs in the motor cortex (M1).
(B) The NMDAR/AMPAR eEPSC ratio was increased in NEX–Trio+/− mice and decreased in NEX–Trio−/− mice relative to WT controls. Unpaired t tests identified differences between groups (n = 12–14 neurons from 4 mice per group).
(C and D) NEX–Trio+/− and NEX–Trio−/− mice had decreased AMPAR–mEPSC amplitude (C, left) and frequency (D, left). NEX–Trio−/− mice also had decreased NMDAR–mEPSC amplitude (C, right) and frequency (D, right). NEX–Trio+/− mice trended toward decreased NMDAR–mEPSC amplitude (C, right) and had decreased NMDAR–mEPSC frequency (D, right).
(E) Representative traces of AMPAR– and NMDAR–mEPSCs from WT, NEX–Trio+/−, and NEX–Trio−/− L5 PNs in the motor cortex (M1).
(F and G) NEX–Trio+/− mice showed no difference in AMPAR– (F) or NMDAR–mEPSC (G) decay time. NEX–Trio−/− mice showed no difference in AMPAR–mEPSC decay time (F) but increased NMDAR–mEPSC decay time (G). To consistently analyze NEX–Trio+/− and NEX–Trio−/− mice independently, unpaired t tests identified differences between groups (n = 28–36 neurons from 5–7 mice per group).
(H) Representative traces of eEPSCs from WT, NEX–Trio+/, and NEX–Trio−/− L5 PNs in the motor cortex (M1) evoked by paired–pulse stimulation of M1 layer 2/3.
(I) An increase in the paired–pulse ratio was observed in NEX–Trio+/− and NEX–Trio−/− mice, suggesting a deficit in presynaptic release probability. A one–phase decay global fit analysis identified differences between groups. Post hoc Bonf MC test indicated that NEX–Trio+/− was significantly different from WT at35* and 60** ms (p = 0.07 at 300 ms), and NEX–Trio+/− was significantly different from WT at 35****, 60****, 100***, and 300** ms (p = 0.18 at 200 ms; n = 20–26 neurons from 5–7 mice per group).
(J) NEX–Trio+/− and NEX–Trio−/− mice had impaired LTP in the motor cortex, showing only slight induction and no potentiation compared to WT controls. LTP was induced at 0 min. RM two–way ANOVA with post hoc Bonf MC test identified differences (n = 9–11 neurons from ≥6 mice per group).
See also Figures S6 and S7. Data are represented as mean ± SEM (*p < 0.05; **p < 0.01; ***p < 0.001; ****p < 0.0001).

