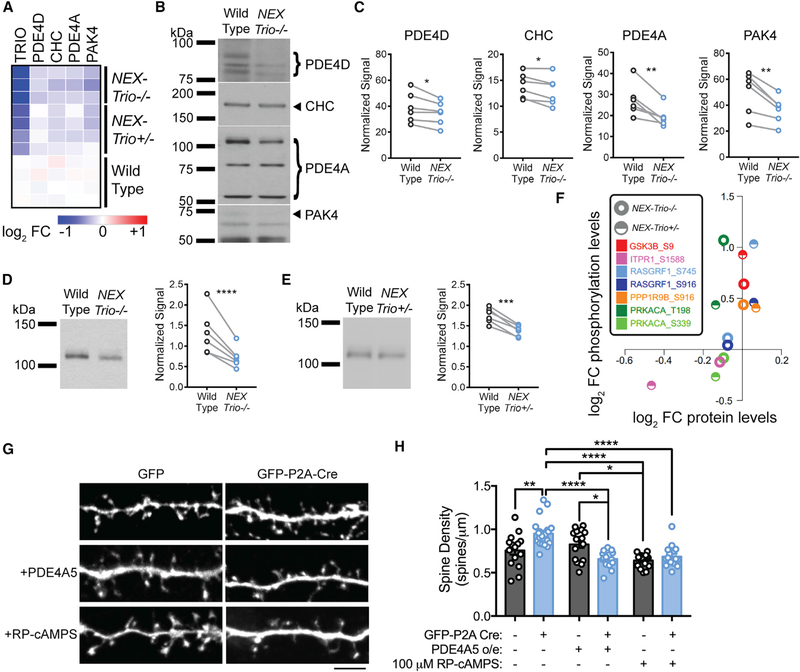
Figure 7. NEX–Trio+/− and NEX–Trio−/− Mice Have Decreased PDE4A5 Levels and Increased PKA Signaling, and PDE4A5 Overexpression and Drug–Based Attenuation of PKA Signaling Rescue Trio–Induced Increases in Dendritic Spine Density.
(A) Heatmap illustrating the log2 fold change (FC) of select proteins compared to WT quantified by mass–spectrometry–based proteomics. All selected proteins were reduced in the motor cortex of NEX–Trio−/− and NEX–Trio+/− mice compared to WT.
(B) Representative immunoblots for selected proteins in the cortex are shown for male NEX–Trio−/− and WT mice (P42); bands of interest are marketed by arrows (single band) or brackets (multiple bands).
(C) PDE4D, CHC, PDE4A, and PAK4 protein levels were reduced in the cortex of NEX–Trio−/− mice relative to WT littermates.
(D and E) PDE4A5 protein levels were reduced in the cortex of NEX–Trio−/− (D) and NEX–Trio+/− (E) mice. Representative immunoblots are shown. Ratio paired t test identified differences (n = 6 littermate pairs).
(F) Scatterplot representing the average log2 FC compared to WT for PKA substrates detected in the kinase–substrate pair enrichment analysis. The log2 FCs at phosphorylation sites are plotted against the log2 FCs of the respective protein levels. Each color represents a distinct PKA substrate phosphorylation site; half circles represent NEX–Trio+/− data, and open circles represent NEX–Trio−/− data.
(G) Representative immunofluorescence images of Trio+/flox neurons transfected with just GFP (WT) or GFP–P2A–Cre (Cre–Trio+/−; top) for 6 days. A subset of neurons was treated with PDE4A5 overexpression (middle) or 100 μM Rp–cAMPS (bottom). Scale bar represents 5 mm.
(H) Dendritic spine density was increased in Cre–positive Trio+/flox neurons, and this was rescued with overexpression (o/e) of PDE4A5 for 6 days or treatment with 100 mM Rp–cAMPS for 3 days. Unpaired t tests identified differences between groups (n = 15–21 dendrite segments from R3 cells per group).
See also Figure S7. Data are represented as mean ± SEM (*p < 0.05; **p < 0.01; ***p < 0.001; ****p < 0.0001).

