Figure 1.
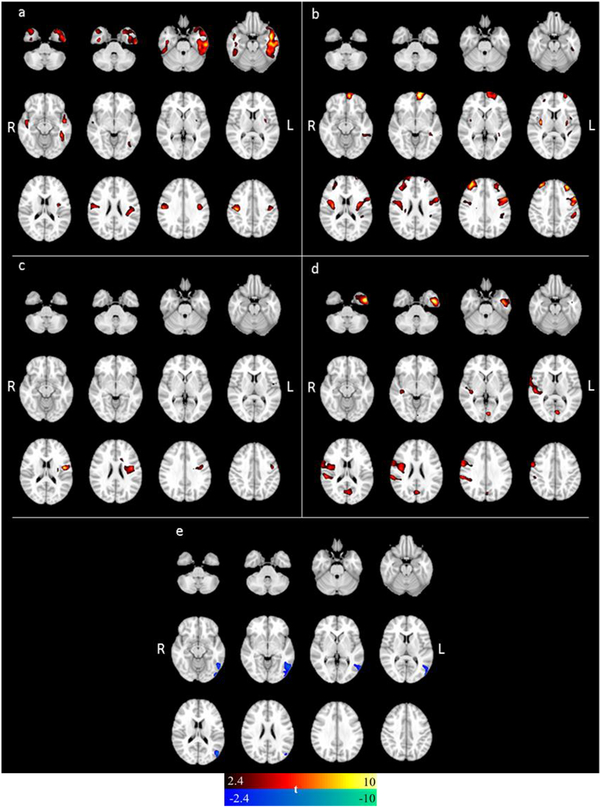
Local clusters of atrophy in the a) Weak class, b) Weak-Visuospatial/Strong-Memory class, c) Weak-Visuospatial class, d) Amnestic class, e) Strong class. All comparisons were done against the Typical class. Color bar indicates the amount of difference between the two classes, a greater t value indicates a larger difference.

