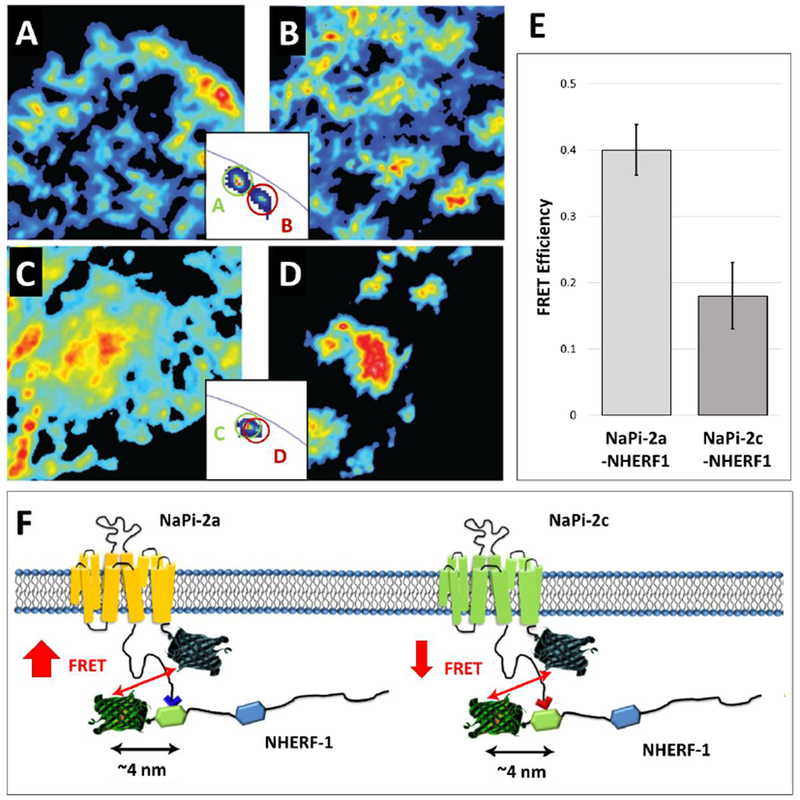
Figure 3.

Interaction of NaPi-2a and NaPi-2c with NHERF1. (A-D) Intensity images of OK cells transfected with Cerulaen-NaPi-2a (A), Cerulean -NaPi-2a plus EYFP-PDZK1 (B), Cerulean -NaPi-2c (C) and Cerulean -NaPi-2c plus EYFP-PDZK1 (D).The two insets exemplify the complex quantification of FRET. (E) Quantification of the FRET signal between NaPi-2a/2c and NHERF1. (F) Schematic representation of NaPi-2a and NaPi-2c interactions with NHERF1. The two NaPi isoforms are depicted with the Cerulean tags; NHERF1 contains two PDZ domains and an N-terminal EYFP tag. Both NaPi-2a and NaPi-2c bind to the first PDZ domain of NHERF1,although NaPi-2c binds with a lower prevalence. Figure adapted from ref 22.
