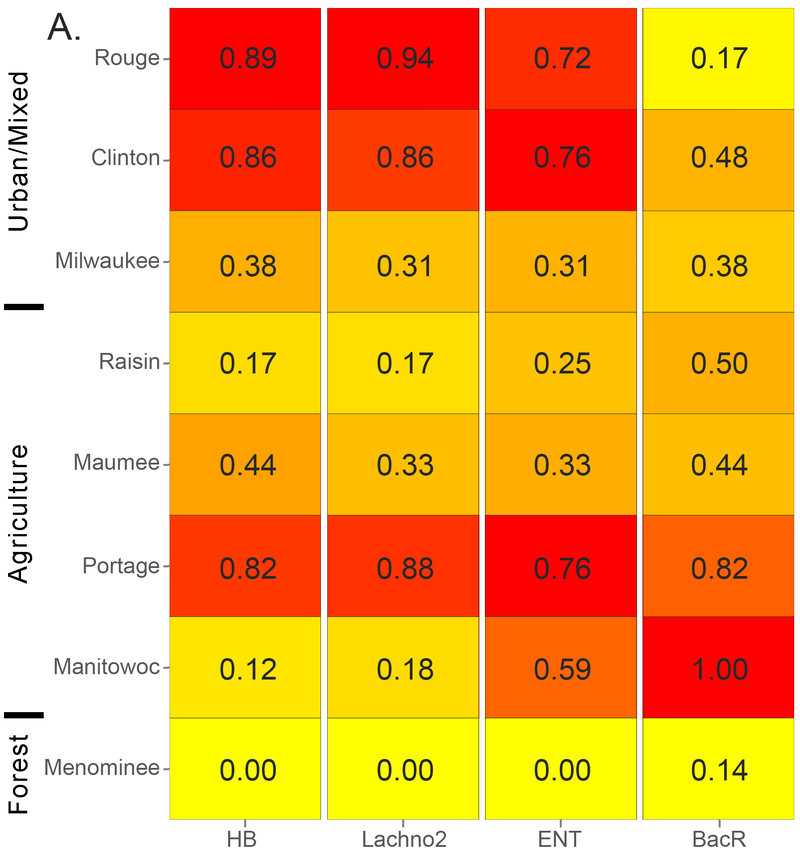
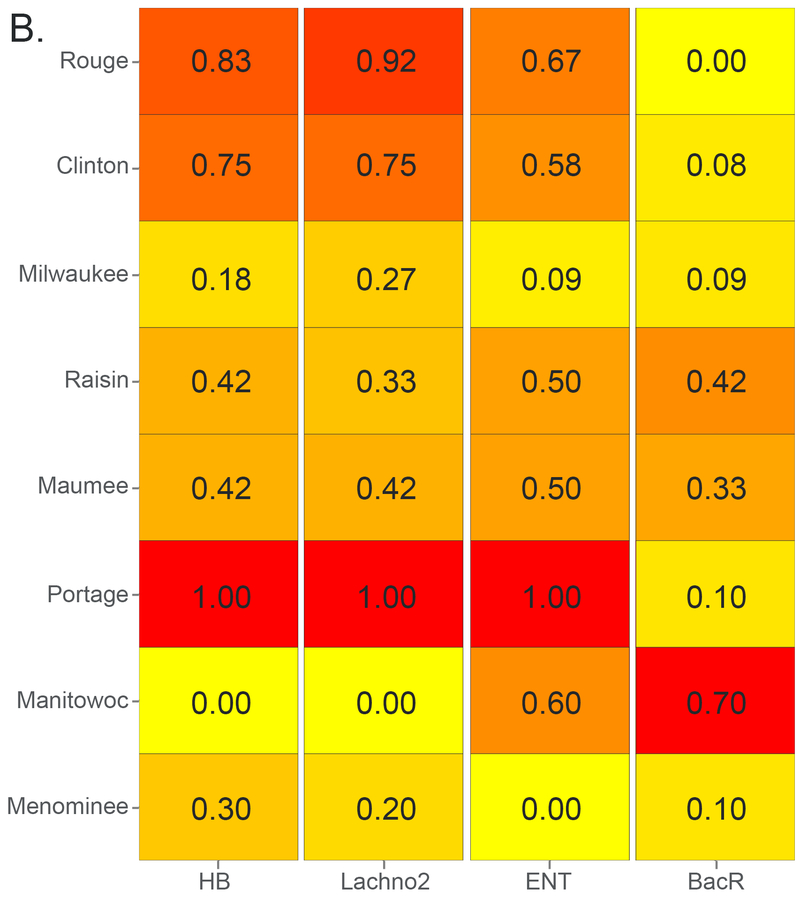
Figure 1.
Heatmaps with frequency of sample concentrations over the median for each host-associated marker during (A) runoff-event periods and (B) low-flow periods for eight Great Lakes tributaries. Ordered top to bottom from most to least urban. HB = human Bacteroides; Lachno2 = human Lachnospiraceae; ENT = enterococci; BacR = ruminant Bacteroides.


