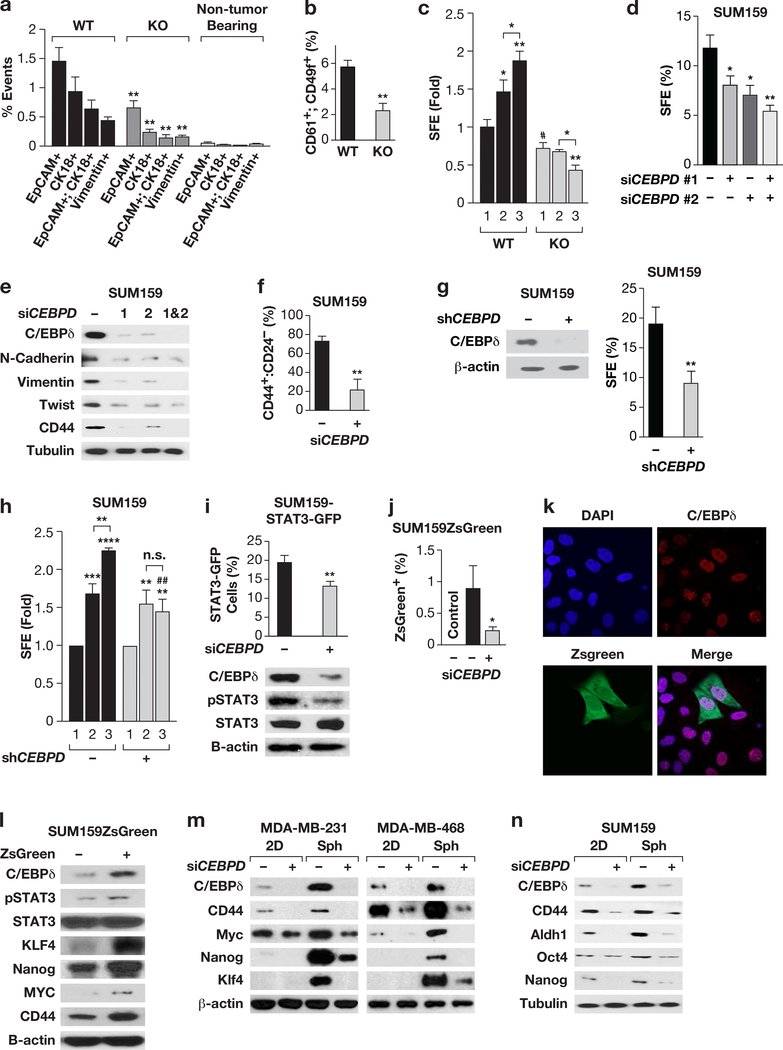
Figure 1. C/EBPδ promotes CSC-like phenotypes in MMTV-Neu mouse mammary tumor cells and human breast cancer cell lines.
(a) Flow-cytometric quantification of epithelial (EpCam+, CK18+)-, and mesenchymal(Vimentin+)-like CTCs42 from peripheral blood of tumorbearing wild-type (WT) and Cebpd-deficient (KO) MMTV-Neu transgenic mice. Data represent the mean ± S.E.M; n=5, **P<0.01, two-tailed unequal variance t-test. Non-tumor bearing Cebpd ko/+ mice were used as negative controls (n=3). (b) Flow-cytometric quantification of CD61+:CD49f+ cells in tumors from mice as in panel (a). Data represent the mean ± S.E.M; n=8, **P<0.01, two-tailed unequal variance t-test. (c) SFE of cells dissociated from tumors and cultured in suspension for 5 days (1st generation) and further cultured for 2nd and 3rd generation spheres (mean ± S.E.M; n=3, *P<0.05, **P<0.01, #P<0.05, two-tailed unequal variance t-test). (d) SFE of SUM159 cells after transfection with Control or two independent CEBPD siRNA oligos (1, 2) alone or in combination (mean ± S.E.M; n=3, *P<0.05, **P<0.01, two-tailed unequal variance t-test). (e) Western analysis of the indicated proteins in SUM159 cells 2d after transfection as in panel (d). (f) Flow-cytometric quantification of CD44+:CD24- cells in SUM159 cell cultures 3d after transfection of siControl and siCEBPD siRNA oligos (mean ± S.E.M; n=3, **P<0.01, two-tailed unequal variance t-test). (g) Representative Western analysis of C/EBPδ expression in SUM159 cells with stable depletion of C/EBPδ (+, shCEBPD) or control cells (-, shControl) as well as SFE (% of cells seeded) after 4 days of culture in suspension. Similar results were obtained with transient silencing of CEBPD (Fig. S1e). (h) Fold change in SFE by 2nd and 3rd generation spheres of SUM159 cells with stable depletion of CEBPD or shControl cells. Data represent the mean ± S.E.M; n=3, **P<0.01, ***P<0.001, ****P<0.0001; ##P<0.01, effect of shCEBPD; n.s., not significant, two-tailed unequal variance t-test. (i) Quantification of STAT3-GFP+ populations from SUM159 cells 72 h after transfection with Control or CEBPD siRNA and the western analysis as indicated (mean ± S.E.M; n=3, **P<0.01, two-tailed unequal variance t-test). (j) Flow-cytometric quantification of green fluorescent cells in SUM159ZsGreen cells transfected with Control or CEBPD siRNA for 72 h. No green cells were detected in control SUM159 cells without ZsGreen (Control). Data represent the mean ± S.E.M; n=3, *P<0.05, two-tailed unequal variance t-test. (k) Representative immunocytochemistry of C/EBPδ expression in SIM159ZsGreen cells. Nuclei were stained with DAPI. (l) Western analysis of the indicated proteins in SUM159ZsGreen sorted by GFP expression. (m, n) Western analysis of the indicated cell lines transfected with Control (−) or CEBPD siRNA (+) for 24 h followed by separation into culture on plastic (2D) or as spheres (Sph.) for 4 days.

