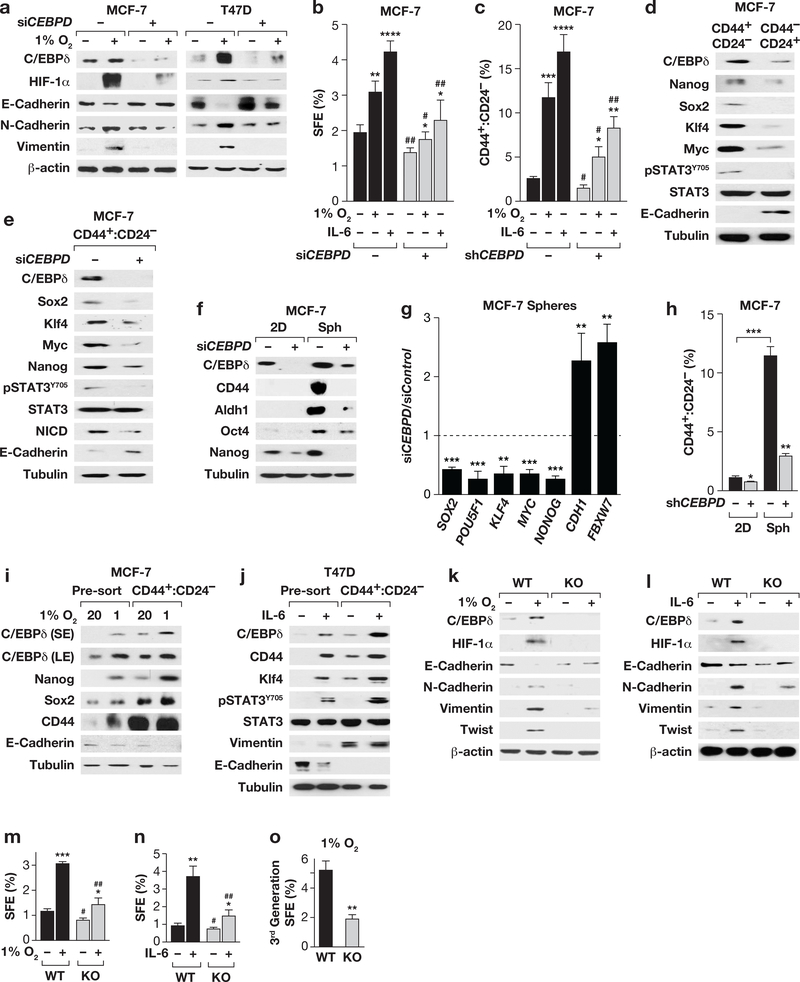
Figure 3. C/EBPδ promotes hypoxia and IL-6-induced CSC-related features in breast cancer cells.
(a) Western analysis of MCF-7 and T47D cells transfected with Control (−) or CEBPD siRNA followed by culture ± 1% O2 for 3 days. (b) SFE of MCF-7 cells transfected and cultured for 4 days in suspension ± IL-6 (100 ng/ml) or 1% O2. Data represent the mean ± S.E.M; n=6, untreated, n=3, treated. *P<0.05, **P<0.01, ****P<0.0001; #P<0.05, ##P<0.01, effect of siCEBPD, two-tailed unequal variance t-test. (c) Flow-cytometric quantification of CD44+:CD24- cells in MCF-7 cells with stable depletion of C/EBPδ (shCEBPD, +) or shControl cells (−) cultured ± 1% O2 or IL-6 (50 ng/ml) for 10 days. Data represent the mean ± S.E.M; n=3, *P<0.05, **P<0.01, ***P<0.001, ****P<0.0001; #p<0.05, ##p<0.01, effect of shCEBPD, two tailed unequal variance t-test. Representative flow cytometry scatter-plots of CD44/CD24 expressing MCF-7 cells are shown in Fig. S2n. (d) Western analysis of the indicated proteins in MCF-7 cell subpopulations as indicated. (e) Western analysis of the CD44+:CD24- population sorted from MCF-7 cells 48 h after transfection with Control or CEBPD siRNA. (f) Western analysis of MCF-7 cells transfected with Control (−) or CEBPD siRNA (+) for 24 h followed by culture on plastic (2D) or as spheres (Sph) for 4 days. (g) qPCR analysis of the indicated genes in MCF-7 cells transfected with siRNAs against Control or CEBPD followed by culture in suspension for 4 days. Data represent the mean ± S.E.M; n=3, ** P<0.01, ***P<0.001, two-tailed unequal variance t-test. Data are shown as relative to the levels in siControl cells. (h) Flow-cytometric quantification of CD44+:CD24- cells in MCF-7 cells treated as described in panel (f). Data represent the mean ± S.E.M; n=3, *P<0.05, **P<0.01, ***P<0.001, two-tailed unequal variance t-test. (i) Western analysis of the indicated proteins in MCF-7 cells cultured ±1% O2 for 10 days followed by FACS isolation of CD44+:CD24- cells, compared to unsorted (pre-sort). (j) Western analysis of the indicated proteins in T47D cells ± IL-6 (50 ng/ml, 10 days), prepared as in panel (i) (S/LE, short/long exposure). (k&l) Western analysis of the indicated proteins in primary tumor cells after 3 days of culture at 1% O2 or with IL-6 (100 ng/ml) as indicated. (m&n) SFE of cells dissociated from tumors and cultured in suspension at 1% O2 or with IL-6 (100 ng/ml) for 5 days as indicated. Data represent the mean ± S.E.M; n=3, *P<0.05, **P<0.01, ***P<0.001; #p<0.05, ##p<0.01, genotype effect within treatment, two-tailed unequal variance t-test. (o) SFE of primary tumor cells from 3rd generation spheres cultured in suspension at 1% O2. Data represent the mean ± S.E.M; n=3, **P<0.01, two-tailed unequal variance t-test.

