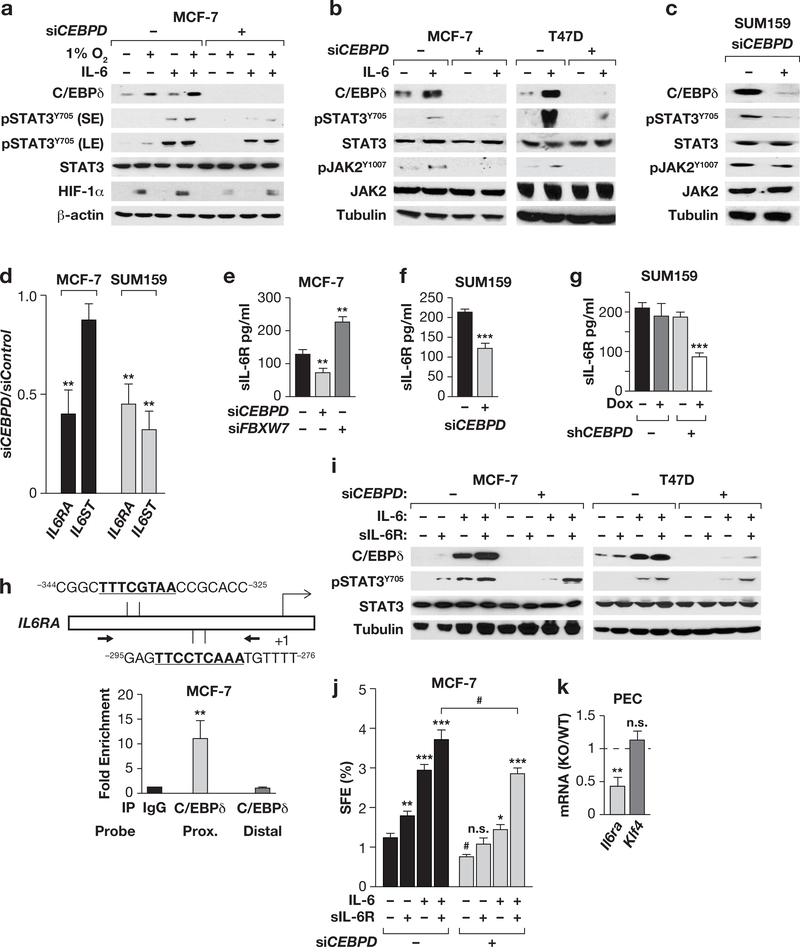
Figure 4. C/EBPδ promotes IL-6 signaling through activation of the IL-6 receptor gene IL6RA.
(a) Western analysis of the indicated proteins in MCF-7 cells ± CEBPD siRNA and cultured ±1% O2 or IL-6 (200 ng/ml) for 8 h (S/LE, short/long exposure). (b) Western analysis of the indicated proteins in MCF-7 and T47D cells ± CEBPD siRNA and cultured ±IL-6 (100 ng/ml, 24 h). (c) Western analysis of the indicated proteins in SUM159 cells 48 h after nucleofection with Control or CEBPD siRNA. (d) qPCR analysis of IL6RA and IL6ST mRNA in MCF-7 and SUM159 cells 48 h after nucleofection with Control or CEBPD siRNA. Data represent the mean ± S.E.M; n=3, **P<0.01, by two-tailed unequal variance t-test. (e&f) Quantification of IL-6Ra protein in the conditioned medium from cells 48 h after transfection with the indicated siRNA. Data represent the mean ± S.E.M; n=3, ** P<0.01, ***P<0.001, two-tailed unequal variance t-test. See Fig. S4d for silencing controls. (g) Quantification of sIL-6Rα in the conditioned media from SUM159 cells with Dox-inducible Control and CEBPD shRNA cells treated ± Dox for 24 h (n=3; ***P<0.001). (h) Schematic showing two C/EBP binding motifs in the IL6R promoter and relative location of qPCR primers for ChIP analysis (bottom panel) with MCF-7 chromatin and a C/EBPd-specific antibody relative to IgG control. Distal: negative control from the CD44 gene. Data represent the mean ± S.E.M; n=3, **P<0.01, twotailed unequal variance t-test. (i) Western analysis of the indicated proteins in MCF-7 and T47D cells ±CEBPD siRNA after 16 h of treatment with IL-6 and/or sIL-6R (200 ng/ml each). (j) SFE of MCF-7 cells under conditions as shown in panel (i). Data represent the mean ± S.E.M; n=3, *P<0.05, **P<0.01, ***P<0.001; #p<0.05, effect of siCEBPD; n.s., not significant, two-tailed unequal variance t-test. (k) qPCR analysis of Il6ra and Klf4 mRNA levels in freshly isolated peritoneal exudate cells (PEC) from Cebpd WT and KO mice; Klf4 is shown as a negative control as it was not altered (n=4; **P<0.01, two-tailed unequal variance t-test.).

