
Figure 20.
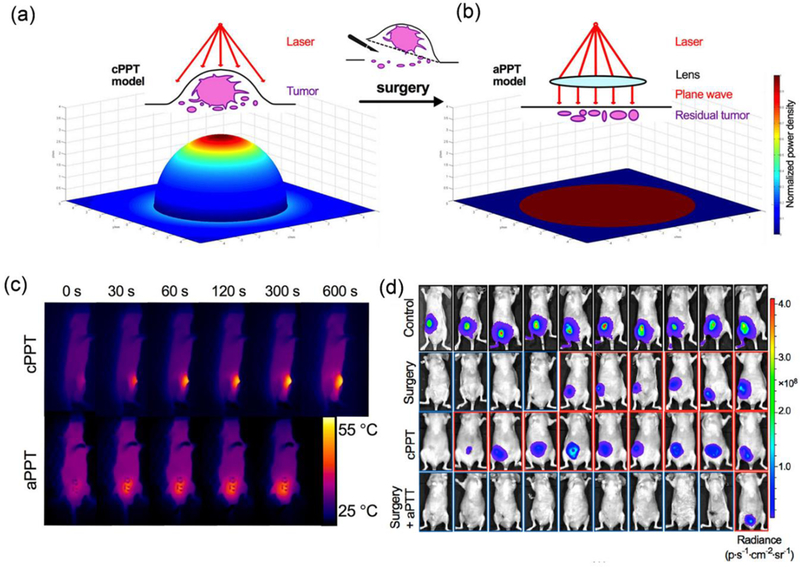
(a) Schematic illustration of conventional PTT (cPTT) and simulated distribution of laser energy in the tumour area. (b) Schematic illustration of aPTT and simulated distribution of laser energy in surgical bed. (c)Thermal images of tumour-bearing mice during cPTT (2.5 W/cm2) and aPTT (1 W/cm2). (d) Bioluminescent images of different groups of tumour-bearing mice with different treatment, including control group, group treated with surgery only, group treated with cPTT only, and the group treated with a combination of surgery and aPTT (from top to bottom). Reproduced from reference 394 with permission from American Chemical Society, copyright 2018