
Figure 24:
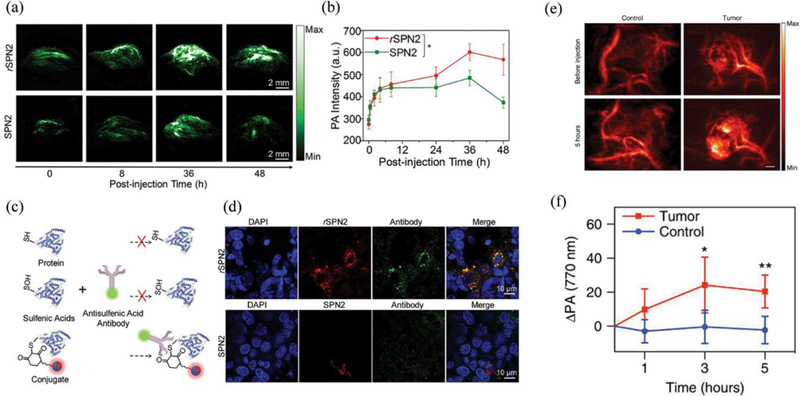
(a) In vivo PAI and (b) quantification of protein sulfenic acids using rSPNP2 or SPNP2. The representative photoacoustic maximum intensity projection (MIP) images with an axial view. (c) Illustration of the mechanism and histological analysis of immunofluorescence staining with the antisulfenic acid antibody. (d) Fluorescence microscopy of tumour slices for mice treated with rSPNP2 or SPNP2 at 48 h of postinjection. (red signals from rSPNP2 or SPNP2, green signals from the staining with an antisulfenic acid antibody, and blue from the nucleus staining. Reproduced from reference 447 with permission from American Chemical Society, copyright 2016. (e) In vivo photoacoustic images (770 nm) of the tumour-bearing and control flank before and 5 h following injection of HyP-1. (Scale bar: 2 mm). (f) Time-dependent photoacoustic signal of ischemic limb and control. Results with error bars are represented as mean ± SD. *p < 0.05, **p < 0.01 (n=4). Reproduced from reference 448 with licence from Creative Commons, copyright 2017.