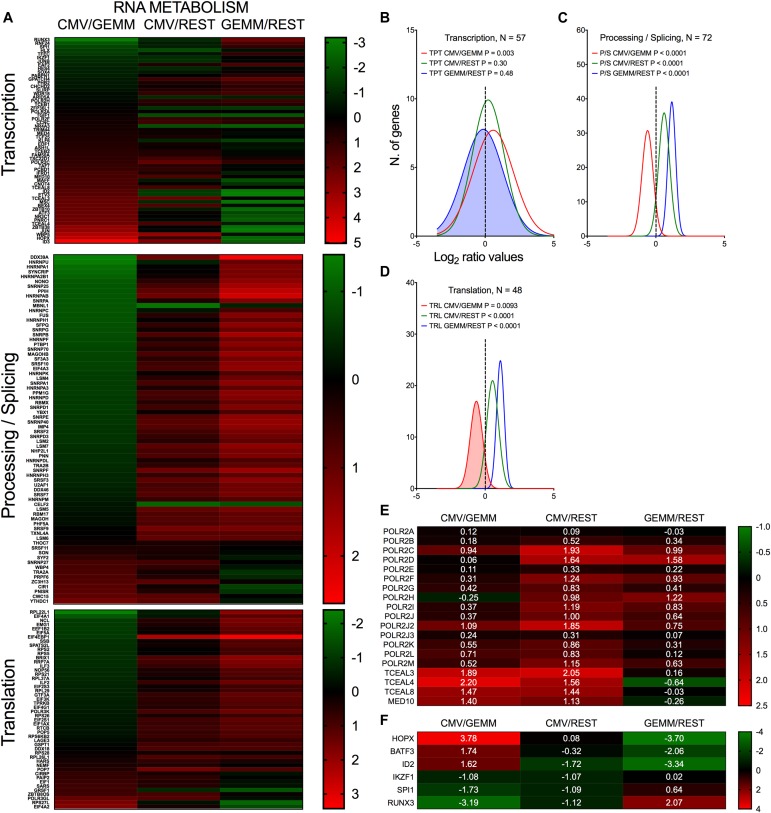
FIGURE 7.
Differential expression of genes with roles in RNA metabolism in GEMM cells, CMV+ cells, and the rest of the population. Heatmap (A,E,F) and distributions (B–D) of Log2 ratio values obtained by dividing the mean number of transcripts/cell of genes with roles in RNA transcription, processing and translation as found in the CMV+ or GEMM clusters by the mean number of transcripts/cell in the rest of the cells (CMV/REST, green line, and GEMM/REST, blue line) or in GEMM cells (CMV/GEMM, red line). The heatmap color scales refer to the Log2 ratio values. Numbers in white font in (E,F) report the Log2 ratio values of each gene. The Wilcoxon signed rank test was used to identify populations with median values significantly different from zero. The population with the lowest P-value is highlighted by coloring of the area under the curve. The dashed line marks the ratio = 1 point. N, number of genes in each category.

