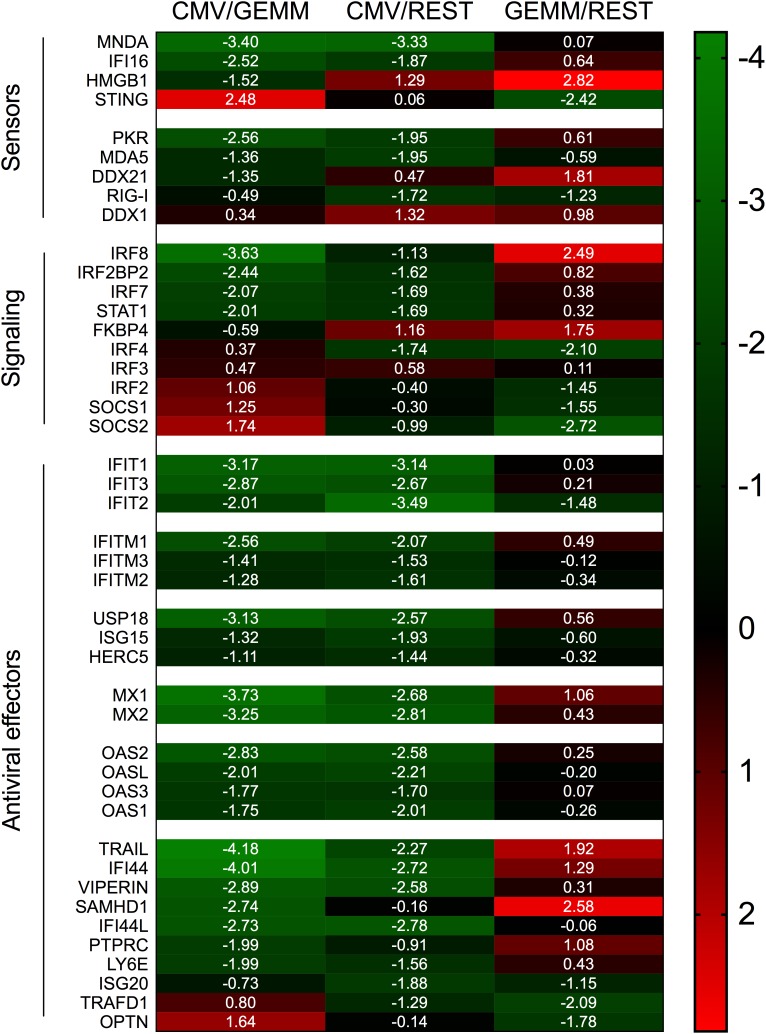
FIGURE 9.
Differential expression of IFN-related genes in GEMM cells, CMV+ cells, and the rest of the population. Heatmap of Log2 ratio values obtained by dividing the mean number of transcripts/cell of IFN-related genes as found in the CMV+ or GEMM clusters by the mean number of transcripts/cell in the rest of the population (CMV/REST and GEMM/REST) or in GEMM cells (CMV/GEMM). The heatmap color scale refers to the Log2 ratio values. Numbers in white font report the Log2 ratio values of each gene.

