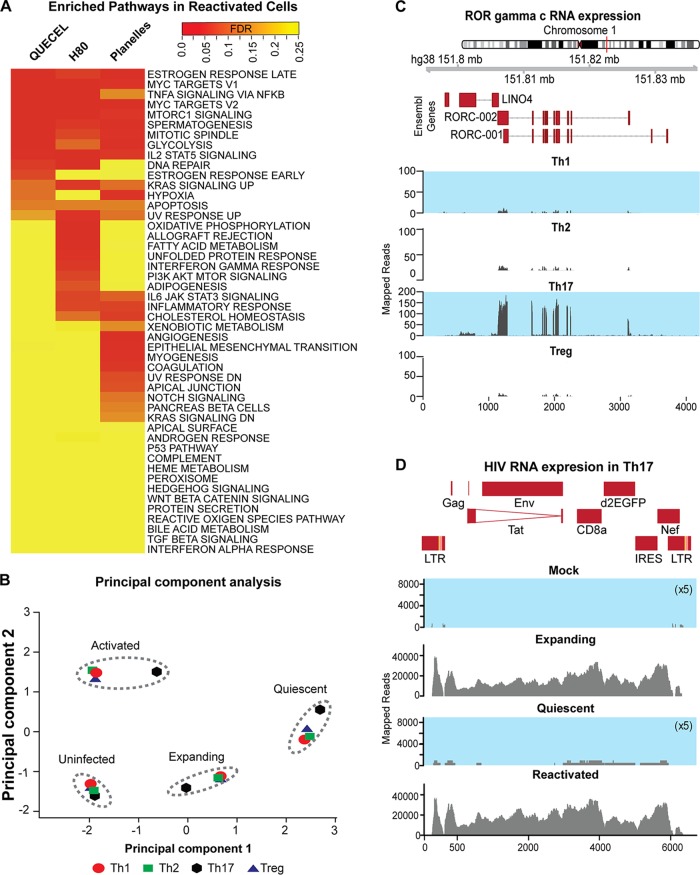
FIG 2.
RNA-Seq analysis of cells at the effector, quiescent, and reactivated stages of the QUECEL method. (A) Pathway analysis indicates that pathways most enriched during reactivation in QUECEL (Th17 cells) are also induced in H80 (BioProject accession number PRJNA376596) and Planelles (BioProject accession number PRJNA322599) ex vivo primary cell models after reactivation. Genes differentially expressed following reactivation of quiescent cells were identified in all three data sets through pairwise comparison of RNA-Seq expression patterns of the quiescent versus reactivated cells and matched to the HALLMARK gene set of the mSigDB using the GSEA tool. The false discovery rate values were used to draw the heat map while controlling for the direction of enrichment. PI3K, phosphatitylinositol 3 kinase. (B) Principal component analysis of expanding, quiescent, and reactivated infected T helper cell subsets and expanding uninfected control using RNA-Seq data. (C) RORγC mRNA expression in each of the T helper cell subsets. Normalized read histograms of RNA-Seq data from uninfected cells are shown. The position of features in nucleotides on hg38 chromosome 1 and the position of the introns and exons of the two isoforms of RORC are shown at the top. (D) HIV mRNA expression in expanding, quiescent, and reactivated infected Th17 T cells and the uninfected control. For panels C and D, the scales to the left of the histograms represent normalized RNA-Seq reads. For uninfected expanding and infected quiescent cells, the scales have been 5× expanded to visualize the small number of mapped reads. The HIV construct used in this study is shown at the top.

