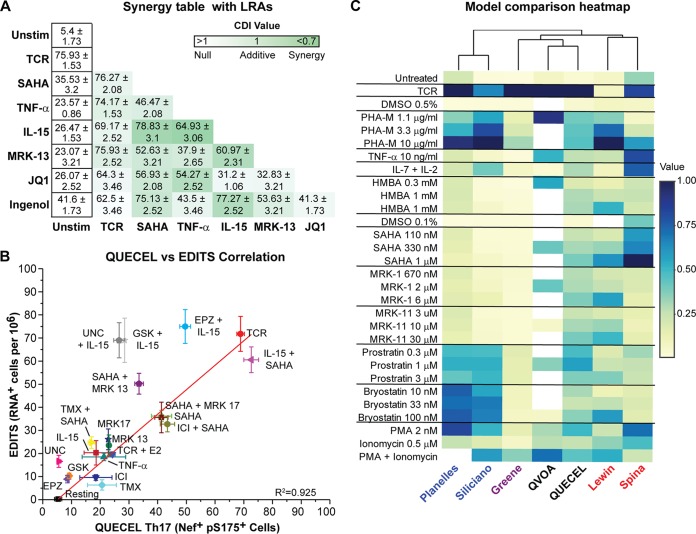
FIG 5.
Correlation between the QUECEL model and RNA induction in patient cells. (A) Synergistic reactivation of HIV in Th17 cells (% Nef+, pS175 CDK9+ cells after 24 h). Green color intensity represents BLISS scores demonstrating additive or synergistic (below 1) activation. (B) Correlation between reactivation of HIV in patient cells (EDITS, vertical axis) and QUECEL model (Th17 cells, horizontal axis) for a wide number of activation conditions. Data were fitted with a linear model (R2 = 0.941; n = 18). (C) Heatmap of responses of QUECEL (Th17 cells) to a panel of primary cell latency models analyzed by Spina et al. (26). Note that the QUECEL model clusters mostly with the QVOA and has a broader dynamic range than the other primary cell models of latency. Normalized values were calculated relative to the highest activation within each model and expressed as a percentage of maximal stimulation. DMSO, dimethyl sulfoxide. PHA-M, phytohemagglutinin-M; PMA, phorbol myristate acetate.

