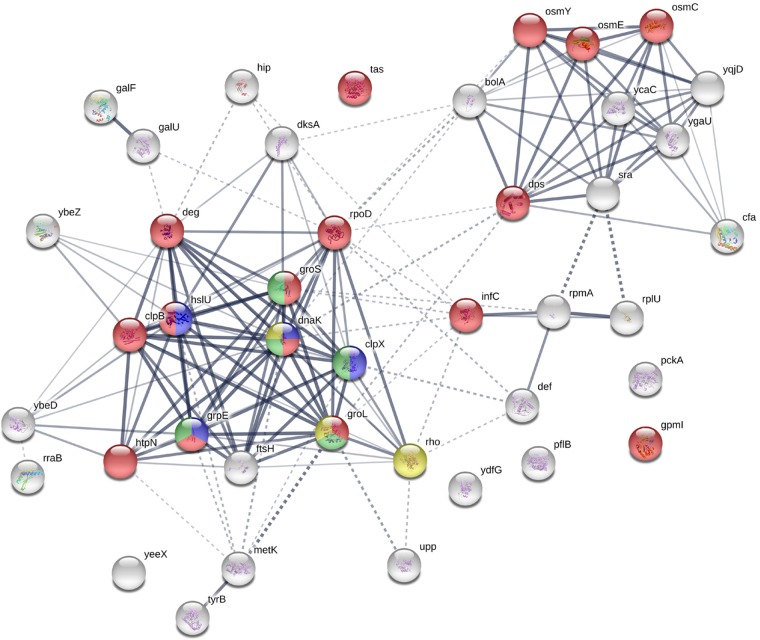
FIG 1.
Interaction map and annotation enrichment of the newly synthesized mazEF-related proteins. String software was used to analyze the interactions. The nodes are colors based on the enriched annotations as detailed here. For Gene Ontology Biological Process (GOBP) identifier (ID) 0043335, the pathway was protein unfolding, the gene count was 4, the FDR was 3.19e–05, and the color is blue. For GOBP ID 0006950, the pathway was response to stress, the gene count was 16, the FDR was 0.00567, and the color is red. For GOBP ID 0019538, the pathway was protein metabolic process, the gene count was 14, the FDR was 0.015, and the color is green. For GOBP ID 0006457, the pathway was protein folding, the gene count was 5, the FDR was 0.0324, and the color is light green. For KEGG ID 03018, the pathway was RNA degradation, the gene count was 3, the FDR was 0.0445, and the color is yellow. For InterPro ID IPR003959, the pathway was ATPase with the AAA-type core, the gene count was 5, the FDR was 9.23e–06, and the color is pink.

