
FIG 2.
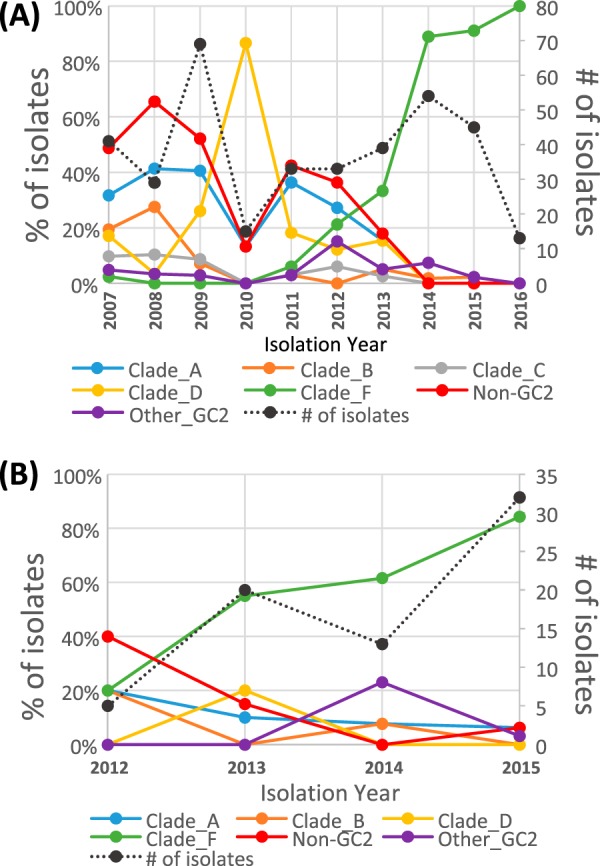
Change in clade abundance over time. The proportions of A. baumannii isolates from hospital system A (A) and hospital system B (B) belonging to each major clade are shown, grouped by the year in which they were isolated. The number of isolates per year is shown as a black dotted line, with units provided on the secondary axis (n = 443 for UH strains and n = 70 for CC strains).