
Figure 3.
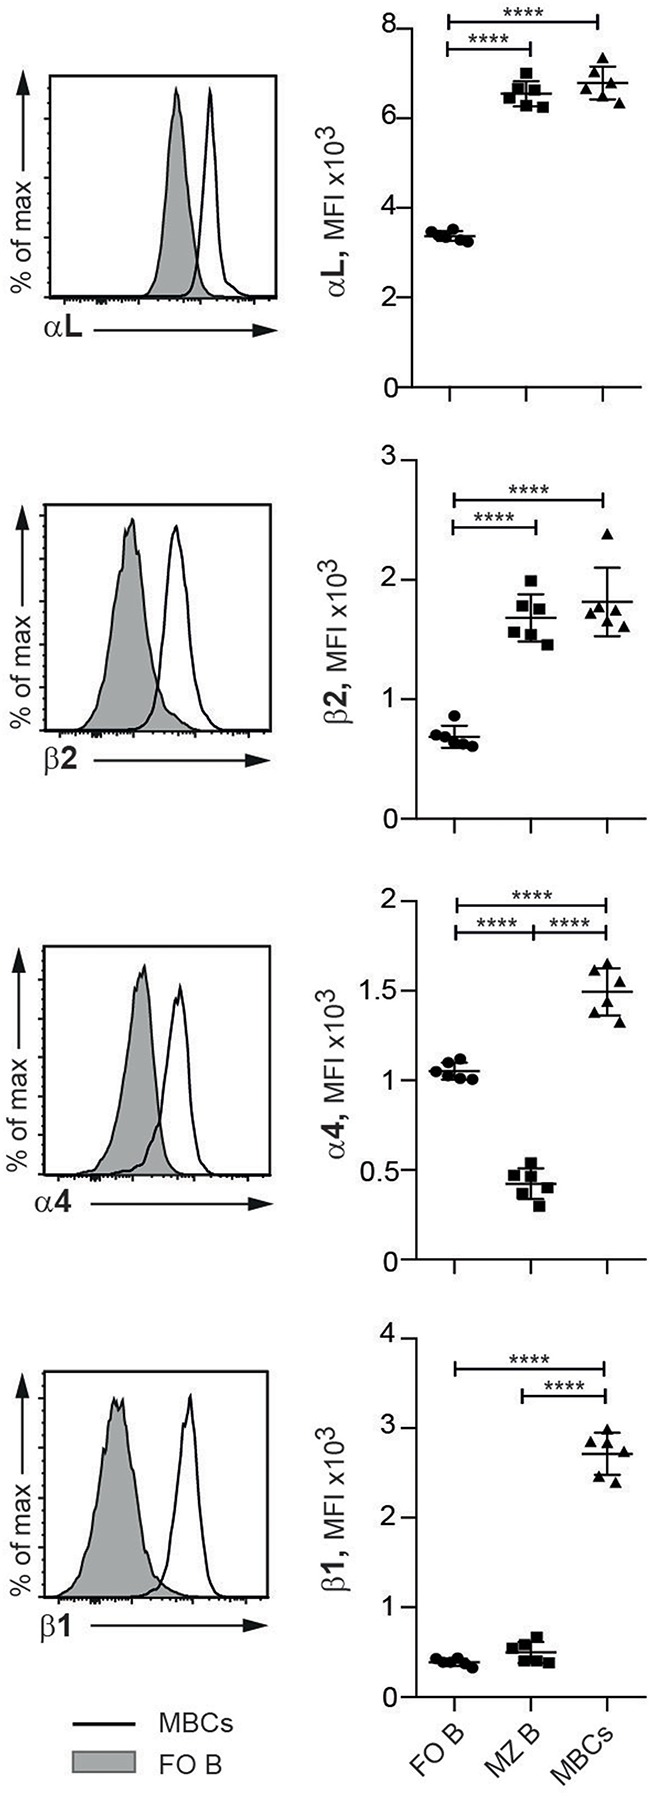
MBCs express higher levels of LFA-1 and VLA-4 than FO and MZ B cells in SLC−/− mice. Flow cytometric analysis of spleen cells from SLC−/− mice. Histograms show the expression of integrins on FO B and MBCs and graphs show the MFIs of integrin subunits αL, β2, α4, and β1 expressed on FO B, MZ B and MBCs. n = 6, data are from three independent experiments; error bars show mean +/–SD. One-way ANOVA with Tukey's multiple comparisons was used (****p < 0.0001).