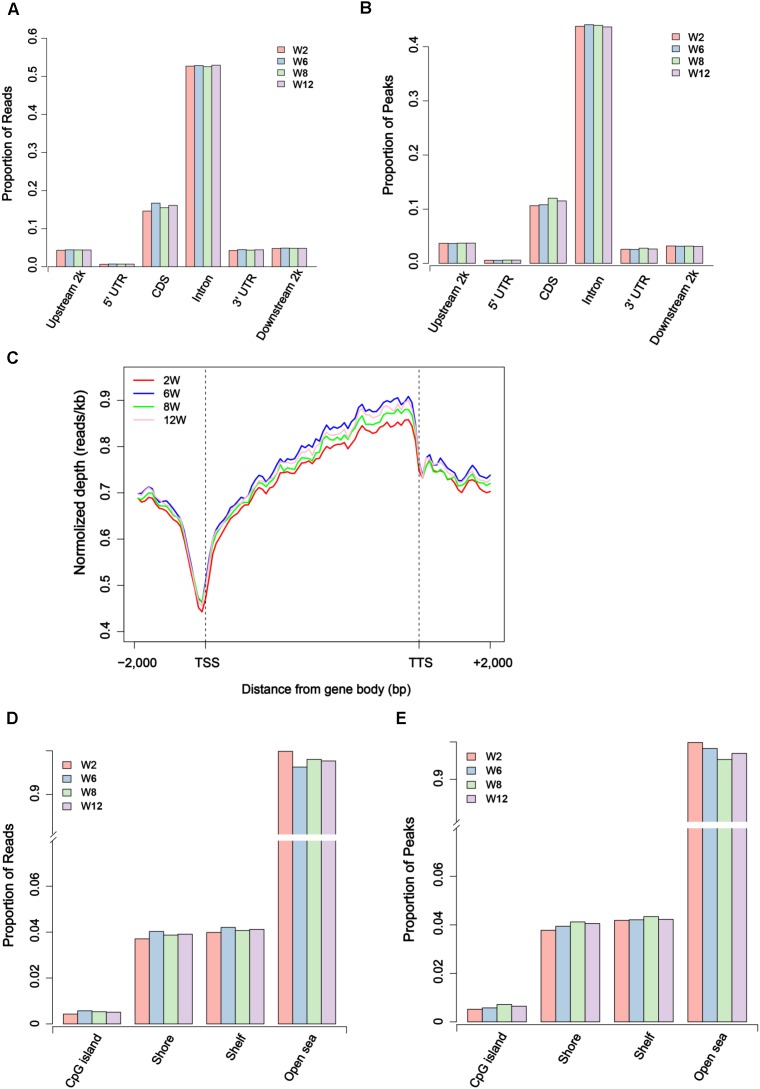
FIGURE 2.
Distribution of unique mapped reads and peaks in different genomic regions. (A) The proportion of unique mapped reads in different gene regions. (B) The proportion of peaks in different gene regions. (C) The distribution of unique mapped reads in 2 kb region upstream of the transcription start site (TSS), the gene body from the TSS to the transcription termination site (TTS), and a 2 kb region downstream of the TTS. (D) The proportion of unique mapped reads in CpG island region and outside CpG regions. (E) The proportion of peaks in CpG island region and outside CpG regions.

