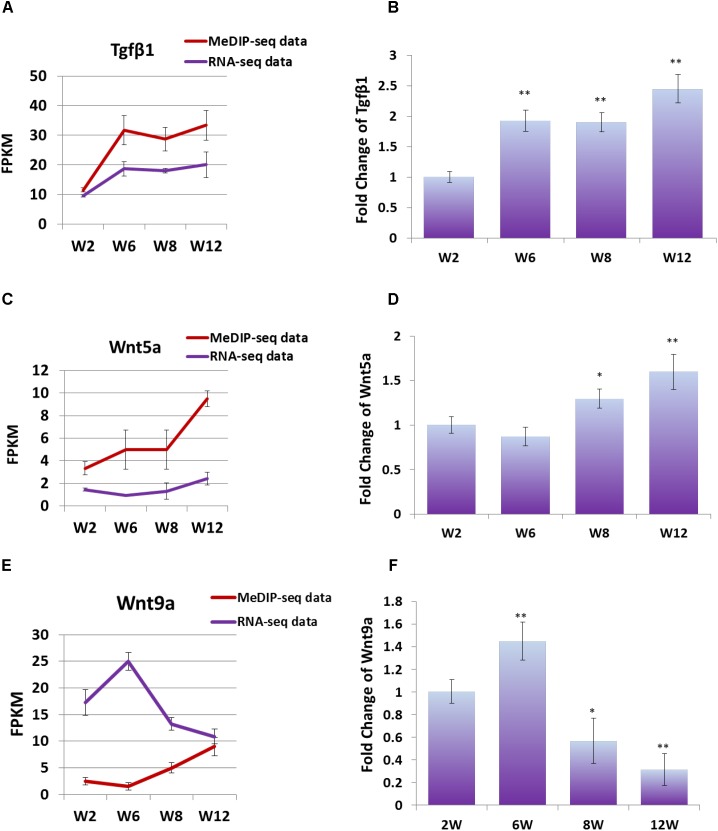
FIGURE 6.
(A) FPKM data were used to compare the variation trend of expression level and methylation level of Tgfβ1 gene. (B) Q-PCR was performed to detect the expression level of Tgfβ1 gene in satellite cells. (C) FPKM data were used to compare the variation trend of expression level and methylation level of Wnt5a gene. (D) Q-PCR was performed to detect the expression level of Wnt5a gene in satellite cells. (E) FPKM data were used to compare the variation trend of expression level and methylation level of Wnt9a gene. (F) Q-PCR was performed to detect the expression level of Wnt9a gene in satellite cells. In Q-PCR experiments, Tubulin was used as the internal control, and the relative fold change was compared to the expression in Week 2 satellite cells. Triplicate samples were analyzed for each treatment, and the results were presented as the mean ± SEM. ∗P < 0.05, ∗∗P < 0.01.

