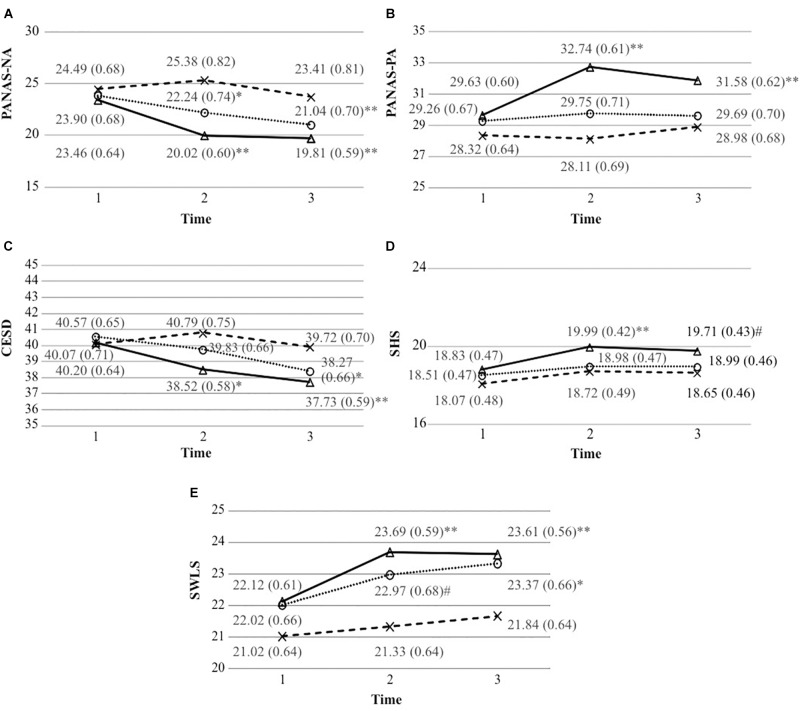
Figure 2.
Mean scale scores (and standard errors) of each group at each time period.(A) Mean scale scores of the positive and negative affect schedule-negative affect (and standard errors). (B) Mean scale scores of the positive and negative affect schedule-positive affect (and standard errors). (C) Mean scale scores of the Center for Epidemiological Studies Depression Scale (and standard errors). (D) Mean scale scores of the Subjective Happiness Scale (and standard errors). (E) Mean scale scores of the Satisfaction With Life Scale (and standard errors). #p < 0.05; ∗p < 0.01; and ∗∗p < 0.01.

