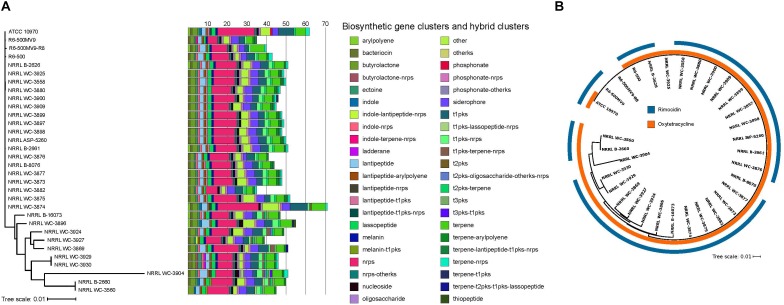
Figure 2.
Distribution of BGCs per genome. (A) BGCs and hybrid clusters were identified using antiSMASH. The maximum likelihood phylogenetic tree was reconstructed using concatenated alignments of 1,945 core genes. Scale bar of phylogenetic tree represents nucleotide substitutions per site. Acronyms: nrps, non-ribosomal peptide synthase; t1pks, type 1 polyketide synthase; t2pks, type II polyketide synthase; t3pks, type III polyketide synthase; ks, ketosynthase. (B) Phylogenetic distribution of the oxytetracycline and rimocidin BGCs. Colored rings outside the tree show the presence/absence of BGCs known to encode for oxytetracycline and rimocidin. The two BGCs were identified by searching all the genomes for homologs of each of the genes comprising the BGCs using BLASTP (Altschul et al., 1990) with a minimum e-value of 10-10. Individual genes in a BGC obtained from previous studies (Seco et al., 2004; Zhang et al., 2006) were used as query sequences. Presence of the BGC was inferred if there were significant BLASTP hits for at least 90% of the individual genes within the BGC.

